E-ISSN:2349-4166
P-ISSN:2349-4158

Research Article

Nutritional

Public Health Review - International Journal of Public Health Research

2020 Volume 6 Number 6 November-December
Publisherwww.medresearch.in

Nutritional assessment of under five children in a rural belt of southern Rajasthan, India

Kumar L. D.1, Mangal N.2*, Varghese K A.3, Chand Salvi T.4, Prakash Salvi P.5, Singh Udawat V.6
DOI: https://doi.org/10.17511/ijphr.2019.i6.03

1 Dilip Kumar L., Associate Professor, Department of Community Medicine, Pacific Institute of Medical Sciences, Udaipur, Rajasthan, India.

2* Nitesh Mangal, Assistant Professor, Department of Community Medicine, Pacific Institute of Medical Sciences, Udaipur, Rajasthan, India.

3 Varghese K A, Statistician, Department of Community Medicine, Pacific Institute of Medical Sciences, Udaipur, Rajasthan, India.

4 Tara Chand Salvi, Medical Social Worker, Department of Community Medicine, Pacific Institute of Medical Sciences, Udaipur, Rajasthan, India.

5 Prem Prakash Salvi, Medical Social Worker, Department of Community Medicine, Pacific Institute of Medical Sciences, Udaipur, Rajasthan, India.

6 Vijaypal Singh Udawat, Health Inspector, Department of Community Medicine, Pacific Institute of Medical Sciences, Udaipur, Rajasthan, India.

Introduction: Despite the importance given by WHO and its member countries, malnutrition of children continued to be a serious problem world-wide, especially in developing countries like India. The uneven magnitude of this problem across Indian states reveals the need for ascertaining the magnitude of malnutrition. Aims & Objectives: The present study is aimed to ascertain the magnitude and the factors affecting the malnutrition across tribal and non-tribal communities in a rural belt of southern Rajasthan. Materials & Methods: The cross-sectional study carried out during March 2018 to February 2019 covering 200 households each from the two communities included 334 and 295 under five children respectively. Results: The magnitude of moderately and severely underweight children was 32.63% and 7.49% in tribal and 24.41% and 4.41% in non-tribal communities. With respect to stunting and Body Mass Index, 64.37% and 63.47% in tribal and 73.22% and 73.90% in non-tribal were found normal. The factors like household income and mother’s literacy were found strongly associated with malnutrition. Conclusion: Nutrition, health education and good access, and utilization of healthcare with separate strategic intervention for tribal and non-tribal children can be very effective interventions to overcome the burden of malnutrition.

Keywords: Malnutrition, Underweight, Stunting, Under-five children, Body Mass Index

Corresponding Author How to Cite this Article To Browse
Nitesh Mangal, Assistant Professor, Department of Community Medicine, Pacific Institute of Medical Sciences, Udaipur, Rajasthan, India.
Email:
Kumar LD, Mangal N, Varghese K A, Salvi TC, Salvi PP, Udawat VS. Nutritional assessment of under five children in a rural belt of southern Rajasthan, India. Public Health Rev Int J Public Health Res. 2020;6(6):224-233.
Available From
https://publichealth.medresearch.in/index.php/ijphr/article/view/125

Manuscript Received Review Round 1 Review Round 2 Review Round 3 Accepted
2019-12-04 2019-12-14 2019-12-20 2019-12-24
Conflict of Interest Funding Ethical Approval Plagiarism X-checker Note
No Nil Yes 6%

© 2020 by Dilip Kumar L., Nitesh Mangal, Varghese K A, Tara Chand Salvi, Prem Prakash Salvi, Vijaypal Singh Udawat and Published by Siddharth Health Research and Social Welfare Society. This is an Open Access article licensed under a Creative Commons Attribution 4.0 International License https://creativecommons.org/licenses/by/4.0/ unported [CC BY 4.0].

Introduction

There has been paradigm shift in priorities of food sector from food self-sufficiency at national level to food security at household level and nutritional security at individual level in India ever since our independence. Eradication of malnutrition of children has been an agenda of topmost priority at global and national level.

Malnutrition has two extremes which includes both the under nutrition as well as the overnutrition and both of these can affect physical, mental and cognitive development of children [1,2]. So it is only the balanced nutrition according to the age which takes care of the proper growth of the children as well as provides the immunity to fight against the diseases [3].

The WHO guidelines to assess malnutrition in terms of weight for age (underweight), height for age (stunting)and weight for height (wasting) made it possible to quantify the extent of malnutrition at country, state, regional and community level [4]. The National Family Health Survey-4 (2015-16) reported that 35.7% of under five children in India are underweight [5].

The Sustainable Development Goals aim to reduce the under-five mortality to 25/1000 live births by 2030 in all countries with special focus on underweight, stunting and wasting of under five children [6,7]. The share of underweight children in rural areas (44%) is reported as higher over that in urban area (30%) implying the need for focused attention in rural areas to overcome the problem of malnutrition in India [8]. The rapid survey on children (2014) reported the extent of low birth weight as 18.5%, underweight of under-five as 29.4%, stunting as 38.7% and wasting as 15.1% [9].

The implementation of various health programmes on children related to nutrition can reduce the burden of malnutrition to a great extent and it will further enhance the socio-economic development of the nation as healthy citizens are a must to build a wealthy nation. The composition of active ingredients of food like protein, carbohydrates, vitamins, minerals, etc. determines the nutritional value of food.

A balanced diet is a diet consisting of right kinds of food in right proportions to supply energy needs of the body of people in different age groups, gender and type of work carried out by them.

The increase in production of food at national level does not ensure equitable distribution of food commodities across states and even between communities in the same state. There is a wide gap between the rural and urban pattern of consumption of food items.

Children under five form a vulnerable group of our population. Children (0-4) constitute about 9.30% of Indian population and 10.70% of Rajasthan’s population as per 2011 census. Proper nutritional intake at this age not only keeps them healthy but also makes them fit for work as they grow. Hence the assessment of nutritional intake of children in rural areas in general and tribal areas in particular assumes great significance.

The reasons behind underweight, stunting and wasting of under five children are generally different. Stunting which is linear growth retardation is attributable to adverse economic conditions, poor sanitation and its associated effect with poor intake of energy sources. Similarly, low weight for age in children which is also termed as underweight problems in children is attributable to repeated illness and starvation.

The low weight for height which is termed as wasting is due to recent or current illness and its adverse consequences to gain weight by children. In general stunting, underweight and wasting which are interlaced to a great extent are commonly used by individual and institutional researchers to assess the magnitude of nutritional imbalances in children in different regions [10].

Stunting and Wasting are the two main nutritional indicators according to the ICMR scientists. Wasting as a measure of malnutrition has the distinct advantage to overcome the errors in reported age of children which depends on the stunting and underweight as indictors of malnutrition [11]. The widely used indicator to assess the disproportionate growth is BMI which is the ratio of weight in kg to height in meter square.

Objectives

The objectives of the present study are;

  • To assess the magnitude of nutritional imbalances of tribal and non-tribal under five children in a rural belt of southern Rajasthan,
  • To identify factors attributable to nutritional status of under five children and

  • To work out calorie intake by tribal and non-tribal children between 24 to 60 months age in relation to standard requirement.

Materials and Methods

Setting: The study was conducted in Khurabad block of Udaipur district where the Rural Health Training Centre (RHTC), Jagat of Pacific Institute of Medical Sciences Udaipur is located. Both the tribal and non-tribal families reside in the study area.

Duration: The study was conducted during a period of one year (from March 2018 to February2019).

Type of study: A cross-sectional descriptive study.

Sampling methods: The stratified random sampling plan with equal allocation of sampling units was used to select households.The households in villages earmarked as the service areas of RHTC were covered.

As these households belonged to both tribal and non-tribal classes, two separate lists of households, one for tribal and another for non-tribal, having at least one under five children were prepared. The sample households were selected randomly from both the classes.

Sample size calculation: As per NFHS-4 [5] the percentage of wasting in Udaipur district was found to be 15.8% which was used to calculate the sample size for the present study. The calculated sample size comes to 206 and hence a sample size of 200 households each was considered for tribal and non-tribal groups having 334 and 295 under five children respectively.

Inclusion criteria: At least one under five child present in the tribal and non-tribal family were selected.

Exclusion criteria: Families not willing to participate and children suffering from any chronic illness.

Data collection procedure: For the purpose of data collection, a well-structured questionnaire was developed after its pre-testing. The socio demographic factors like age and sex as well as anthropometric measurements like weight and height were noted forthe under five children in selected households. The information related to size of land owned, household income, mother’s education andplace of delivery were collected from each selected households in both tribal and non-tribal areas.

Also the food intake including liquid and solid taken by the children above 24 months of age was recorded in the questionnaire using dietary recall method for the previous day of interview of each child.

The weight in kilograms was taken with the weighing scale to assess their growth and nutritional status using the standard technique to the nearest 0.5 kg. Also the height was taken of selected children using stadiometer / infantometer to the nearest 0.1cm using the standard technique [12]. The length of children up to two years was measured and beyond that their height was taken to work out BMI. With release of WHO child growth standards in 2006, the trajectory of malnutrition can be studied in terms of weight for age (underweight), height for age (stunting) and weight for height (wasting) [4].

The indices such as weight for age to assess underweight, height/length for age to assess stunting and weight for height to assess wasting problems were used to classify the malnutrition.

Data analysis: The data was entered into excel sheet and analyzed using appropriate statistical tests.The indicators based on weight and height for age were assessed and compared with WHO growth reference standards (2006) to assess the nutritional status of children. The classification of malnutrition as normal, moderate or severe was made based on Z scores of the three nutritional indicators expressed with respect to standard deviation units from the median of the populations. The WHO published limits for median ±1, ±2 and ±3 standard deviation levels for underweight, stunting and BMI for children below five years were adopted.

Those scores up to median -2SD were categorized as normal and that between -2SD and -3SD were categorized as moderate and those scores below median – 3SD were categorized as severe malnutrition as per WHO child growth standards [9]. Obviously the overweight and obese cases were not a problem in the rural belt covered under present study.

The food intake by the children was converted into calories using the conversion table published by National Nutrition Institute of Hyderabad. However the accuracy of the calorie intake depends on the exactness of physical quantity of food items provided by the respondents and also its conversion into grams by the researchers before converting into calorie terms.


The factors associated with nutritional problems were assessed using Chi square test. The statistical significance between tribal and non-tribal children in their calorie intake was tested using SND test (Z test) for equality of means of two proportions.

Ethical permission: The study was approved by the Institutional Ethical Committee.

Results

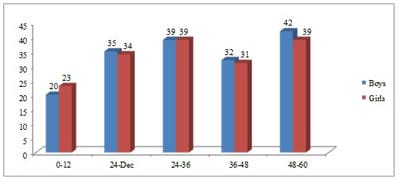
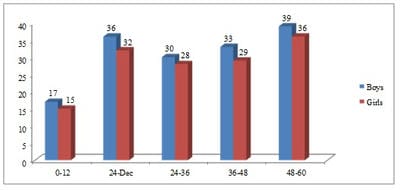
In all there were 334 under five children in 200 selected tribal families and 295 under five children in 200 non-tribal (other communities) families implying more number of under five children in tribal families compared to non-tribal families. The age wise distribution was more even across age classes except infants below one year for both tribal and non-tribal families (Figure 1 & 2).

public_125_01.jpg

Fig-1:Age and gender wise distribution of under five children in tribal area (n=334).

public_125_02.jpg

Fig-2: Age and gender wise distribution of under five children in non- tribal area (n=295).

The under five children in selected tribal and non-tribal families were assessed for underweight (weight for age), stunting (height for age) and Body Mass Index on WHO standards. Out of 334 under five children in tribal group, 200 (59.88%) were normal in weight (no underweight), 109 (32.63%) were moderately underweight and 25 (7.49%) were severely underweight.

Similarly out of 295 under five children in non-tribal group, 210 (71.18%) were normal, 72 (24.41%) were moderately underweight and 13 (4.41%) were severely underweight implying that the share of malnutrition in terms of underweight was more in tribal children compared to non-tribal children.

In both the classes the share of normal male children was higher over female children. While the shares of normal and moderately underweight children in tribal and non-tribal groups were statistically significant, that for severely category was not statistically significant (Table 1).

Out of 334 tribal children, 215 (64.37%) were above median -2SD standard level whereas in non-tribal group out of 295 children, 216 (73.22%) were above median – 2SD standard level with respect to stunting indicating the relative share of normal children in non-tribal group was significantly higher than tribal group.

It is worth mentioning that there has not been any significant gender effect in relative share of children having moderately stunting problem.

The shares of normal children according to stunting in tribal and non-tribal groups have been statistically significant and also the shares for moderately stunting problems between these two social classes. However, the shares of severely stunting classes did not show any significant differences (Table 2).


Table-1: Extent of underweight problem among under five children as per WHO standards.

Weight for age (Z-score) Tribal (n=334) Non-tribal (n=295) P value
Boys (n=168) Girls (n=166) Total (n=334) Boys (n=155) Girls (n=140) Total (n=295)
No underweight {Up to-2SD} n (%) 104(61.91) 96(57.83) 200(59.88) 114(73.55) 96(68.57) 210(71.18) 0.002
Moderate underweight {-2SD to-3SD} n (%) 54(32.14) 55(33.13) 109(32.63) 34(21.93) 38(27.14) 72(24.41) 0.023
Severe underweight {<-3SD} n (%) 10(5.95) 15(9.04) 25(7.49) 7(4.52) 6(4.29) 13(4.41) 0.105

Table-2: Extent of stunting among under five children as per WHO child growth standards.

Height for age (Z‑score) Tribal (n=334) Non-tribal (n=295) P value
Boys (n=168) Girls (n=166) Total (n=334) Boys (n=155) Girls (n=140) Total (n=295)
No stunting {Up to-2SD} n (%) 108(64.28) 107(64.46) 215(64.37) 117(75.48) 99(70.71) 216(73.22) 0.01
Moderate stunting {-2SD to-3SD} n(%) 50(29.76) 47(28.31) 97(29.04) 31(20.00) 33(23.57) 64(21.69) 0.03
Severe stunting {< -3SD} n (%) 10(5.95) 12(7.23) 22(6.59) 7(4.52) 8(5.71) 15(5.08) 0.423

Body Mass Index is another indicator for overweight or underweight of children with respect to their weight for height. It is an indicator similar to wasting as wasting syndrome is due to poor development of muscles and fat tissues consequent to malnutrition.

The WHO standard for BMI which is a measure of body weight in relation to height of children was available and the same was adopted in the study.

The distribution of selected children according to classes based on BMI indicators revealed that 212 (63.47%) out of 334 tribal children were normal

against 218 (73.90%) out of 295 children from non-tribal classes and these proportions are statistically significant.

While the shares of children falling in severely wasting class for tribal and non-tribal classes were non-significant, the shares of children falling in acute problem classes based on BMI was statistically significant.

The relative share of boys and girls of tribal and non-tribal classes did not show any significant variation indicating that the low BMI problem is neutral to gender effect in the study area (Table 3).


Table-3: Extent of BMI among under five children as per WHO standards.

Weight for height (Z‑score) Tribal (n=334) Non-tribal (n=295) P value
Boys (n=168) Girls (n=166) Total (n=334) Boys (n=155) Girls (n=140) Total (n=295)
No wasting {Up to -2SD} n (%) 108(64.29) 104(62.65) 212(63.47) 116(74.84) 102(72.85) 218(73.90) 0.004
Moderate wasting {-2SD to-3SD} n(%) 50(29.76) 45(27.11) 95(28.44) 31(20.00) 29(20.72) 60(20.34) 0.018
Severe wasting {<-3SD} n (%) 10(5.95) 17(10.24) 27(8.08) 8(5.16) 9(6.43) 17(5.76) 0.254

The assessment of factors responsible for malnutrition revealed that the land size, mixed farming practices with crop farming and animal rearing, the size of household income, size of family and mother’s education have a pivotal role in deciding the nutritional status of under five children.

Remarkably, the hospital delivery was found a non-deciding factor on nutritional level of under five children as the incentive for hospital delivery seems to have no significant impact on post-delivery growth and development of children (Table 4).


Table-4: Factors associated with underweight among the studied children.

Factors Level of factor Category of children (No.) Calculated chi square value P value
Normal (n=334) Underweight (n=295)
Land Ownership ˃ 1ha. 245 98 12.96 0.003
< 1ha. 165 121
Mix Farming (Crop +Animal) at farm Yes 255 101 15.01 0.0001
No 155 118
Household Income Moderate 220 87 11.09 0.0008
Low 190 132
Mothers’ Education Literate 233 101 6.57 0.01
Illiterate 177 118
Hospital Delivery Yes 222 107 2.50 0.11
No 178 112
Family Size Big (> 4) 196 124 4.43 0.035
Small (< 4) 214 95

The energy intake of the children between 24 months and 60months was found to increase with increase in age for both tribal and non-tribal children. The average calorie intake of male children was more than that of female children for tribal and non-tribal communities. The combined calorie intake of non-tribal children was higher over that of tribal children in the age group of 24 to 60 months.

The relatively high values of Coefficient of Variation in calorie intake for tribal children compared to non-tribal children and also the increase in CV values of calorie intake with increase in age is a matter of concern. In both the classes the CV values of calorie intake for girls were higher over boys (Table 5).


Table-5: Energy (Kcal) intake of children between 24-60 months.

Age class Particulars Energy intake Tribal (Kcal) Energy intake Non-tribal (Kcal) SND test (Combined tribal vs non-tribal)
Boys Girls Combined Boys Girls Combined Calculated ‘Z’ value P value
24-36 months Mean 713 694 703 844 811 828 5.67 <0.0001
SD 131.9 136.0 134.3 112.5 118.4 116.5
CV (%) 18.5 19.6 19.1 13.3 14.6 14.1
36-48 months Mean 761 724 743 919 863 893 5.73 <0.0001
SD 153.7 162.2 159.02 129.6 128.6 132.1
CV (%) 20.2 22.4 21.4 14.1 14.9 14.8
48-60 months Mean 983 905 945 1016 1128 1070 3.94 =0.0001
SD 214.3 209.9 215.7 155.4 179.4 176.4
CV (%) 21.8 23.2 22.8 15.3 15.9 16.5

Discussion

Nutritional imbalance of children is a global problem of varying magnitude across different countries as well as between urban and rural regions of the same country. The National Nutritional Strategy reported that the problem of under nutrition of under five children is a grave problem in India despite improvement over the years [13].

As per NFHS-3 and NFHS-4 the prevalence of stunting has declined from 48.00% to 38.40% and that for underweight has declined from 42.5% to 35.7% while that of wasting has marginally gone up from 19.8% to 21.00% [14]. As per the National Nutrition Mission the targets of child stunting is to reduce the prevalence up to 25% by 2022 and also to 2 percentage point reduction in prevalence annually in child underweight from 2017 to 2022 [15,16].

Also the WHO and UNICEF 2030 targets to achieve prevalence of child wasting to less than 3% by 2030 [17]. It is felt that concerted efforts are needed to overcome this grave situation. Underweight among children is an indicator of malnutrition posing more risk for morbidity and mortality in children. In the present study, the prevalence of underweight among tribal children was 40.12% and that of non-tribal was 28.82%.

In a study conducted by Stanly AM et al (2015) [18] found the prevalence of underweight among 385 children residing in the rural area of Chennai was 42.9%. In another study done by Yadav SS (2016) [19] et al revealed that the prevalence of underweight was 41.3% in a rural area of Haryana.

Similar findings were observed by other studies conducted by Sukla P et al [20] at Chhattisgarh, Mamulwar MS et al [21] in Pune and Islam S et al [22] in a tribal area of Dibrugarh district of Assam which found the prevalence rate of underweight between 29.00% to 36.00% respectively. While in contrast, the study done by Radhamani KV et al [23] showed the prevalence rate of underweight as 14.60% at North Kerala. The higher prevalence of underweight in the present study could be due to low literacy level of the mothers.

The stunting (height for age) is another indicator widely used to assess level of malnutrition among children. In other words, stunting is attributable to long term deprivation of required nutrition for growth and development of children. The prevalence of stunting problem among tribal and non-tribal children in the present study was 35.62% and 26.78% respectively.

The prevalence of stunting was reported as 31.6% among 224 under five children in a rural area of Pondicherry [24].


In another study conducted by Anandi BS et al [25] found the prevalence of stunting among 201 children residing in a Rural Area of Kalaburagi District was 36.3%.

In different studies conducted by Sukla P et al [20] at Chhattisgarh, Singh H et al [26] in tribal district of Kinnaur in Himachal Pradesh and Chakravarthy KB et al (2015) [27] in Andhra Pradesh found the prevalence rate of stunting between 27.40% to 35.50% which were similar to the present study. In another study done by Radhamani KV et al [23] found the prevalence rate of stunting as 10.60% which is very low when compared to the present study. The reason for higher prevalence of stunting in the present study may be because of poor diet intake and repeated infections among the children.

Body Mass Index is another indicator for overweight or underweight of children with respect to their height. It is an indicator similar to wasting as wasting syndrome is due to poor development of muscles and fat tissues consequent to malnutrition. The low BMI was found in 36.53% of tribal children and 26.10% of non-tribal children. The various studied done by Chakravarthy KB et al [27], Radhamani KV et al [23], Prinja S et al [28] and Mamulwar MS et al [21] found the prevalence rate of wasting between 16.10% to 16.90% respectively.

Severe acute malnutrition (SAM) affects nearly 20 million preschool-age children all over the world mainly from south-east Asia and Africa [29]. The prevalence of Severe Acute Malnutrition (SAM) is around 7.4 per cent across India [11]. In the present study, the prevalence of severe acute malnutrition was about 8.08% in tribal and 5.76% in non-tribal area. These results were in close proximity to the prevalence reported by NFHS-4 of about 7.4% all over India [2].

Mother’s care is a primary factor for the children’s growth and development. The three important factors such as maternal literacy, maternal nutritional status and maternal nutritional knowledge were also important to determine the child’s nutritional status [30]. Of these mothers education was the key element considered in the present study.

In the present study, various factors such as mix farming, mother’s education and household income were found to be significantly associated with undernutrition. Similar findings were reported in a study conducted by Laxmikant Purohit et al [31] in Maharashtra and Patel P [32] in Gujarat.

Mother’s educational status was significantly associated with under-nutrition in the study done at Kalaburagi District of Karnataka [25]. Various studies done by Tiwari SR et al [33] in Mumbai, Sarkar S et al [34] in West Bengal and Upadhyay et al [35] in Puducherry showed that household income was significantly associated with malnutrition.

Balanced growth of under five children implies appropriate weight and height for age and normal Body Mass Index (BMI). Maintaining the same is a tedious task, the onus of which lies on mothers. Development of a balanced diet schedule for under five children with locally available food stuff and educating mothers for its adherence can solve the problem of malnutrition (underweight, stunting and wasting) to a great extent.

Here it is to be pointed out that a large number of centrally funded schemes including the Poshan Abiyaan which was implemented in the year 2018 are in vogue in various states of the country. The current level of malnutrition at national level as well in the study area is a matter of serious consideration.

However the current scenario may change in the near future with the implementation of Poshan Abhiyaan keeping Anganwadi as the focal point as it aims to ensure holistic development and adequate nutrition for pregnant women, mothers and children [36].

Conclusion

The children below five years are the most vulnerable to under nutrition and its adverse effects. Nutrition, health education and good access, and utilization of healthcare can be very effective interventions which could result in substantial reduction in under nutrition prevalent in rural children.

Recommendations

The families from both the communities should be encouraged for diversified home-based food production activities to improve the nutritional status of children as large chunk of food intake is dependent on home production or local availability.

Severely malnourished children should be surveyed on regular basis and home visits should be made to monitor as well as to improve their food intake.

Parents of the malnourished children should be


counselled for nutritious diet, importance of family planning and personal hygiene by the experts at the time of home visits.

A qualitative study in the form of in-depth knowledge empowerment and focused group discussion among parents of malnourished children should be carried out to adopt various measures to overcome malnutrition and other practices within a stipulated time frame.

What the study adds to the existing knowledge

The present study was aimed to compare the level and factors related to malnutrition among the tribal and the non-tribal under-five children in the same rural area. The finding throw light on the need to have separate strategic intervention for tribal and non-tribal families to overcome the problem of malnutrition.

Author’s contributions

Dr. Dilip Kumar L: The selection of the topic, methodology and manuscript writing were done by the principal author.

Dr. Nitesh Mangal:

The work related to the questionnaire framing and interpretations of the results were done by the corresponding author.

Dr. K.A. Varghese: The data analysis as well as the appropriate statistical tests were applied by the statistician. Also, the final proof reading was done.

Mr. Tarachand & Mr. Prem Prakash Salvi: The preparation of household lists for tribal and non-tribal families and the collection of data from selected households were done by both the Medical Social Workers.

Mr. Vijaypal Singh Udawat: The collected data was entered on MS excel sheet by Health Inspector.

Reference

  1. Chaudhary P, Agrawal M. Malnutrition and associated factors among children below five years of age residing in slum area of Jaipur City, Rajasthan, India. Asian J Clin Nutr. 2019;11(1)1-8.
  1. Black RE, Allen LH, Bhutta ZA, Caulfield LE, De Onis M, Ezzati M, et al. Maternal and child undernutrition global and regional exposures and health consequences. Lancet. 2008;371(9608)243-260.
  2. Rahaman SK, Das S, Dash SK, Giri B, Ali KM. Nutritional Status of Primary School Children in Different Parts of India- A Review. Int J Cur Res Rev. 2019;11(7)1-4.
  3. WHO child growth standards Length/height-for-age, weight-for-age, weight-for-length, weight-for-height and body mass index-for-age Methods and development. Department of Nutrition for Health and Development. World Health Organization. 2006.
  4. National Family Health Survey- 4 2015-16. State Fact Sheet Rajasthan Ministry of Health and Family Welfare.
  5. Sustainable Development Goals (SDG) and Corporate Social Responsibility (CSR), India.
  6. UN General Assembly. Report of the Open Working Group of the General Assembly on Sustainable Development Goals. 12 August, 2014.
  7. Situation Analyses, Backdrop to the National Health Policy; 2017. Ministry of Health and Family Welfare, GOI.
  8. Park K. Park’s textbook of preventive and social medicine. 24th ed, Jabalpur- M/s Banarsidas Bhanot publishers. 2013.
  9. Bloss E, Wainaina F, Bailey RC. Prevalence and Predictors of Underweight, Stunting and Wasting among Children Aged 5 and Under in Western Kenya. J Trop Pediat. 2004;50(5)260-270.

  1. Hemalatha R, Radhakrishna KV, Kumar NB. Undernutrition in children & critical windows of opportunity in Indian context. Ind J Med Res. 2018;148(5)612-620.
  2. Kaur H, Biswas M, Malik P, Chauhan I, Babli, Manoj. Assessment of Nutritional Status of Under -5 Children using WHO Growth Standards. Int J Sci Res. 2018;7(7)30-32.
  3. Nourishing India National Nutrition Strategy, Government of India.
  4. Nutrition Landscape Information System (NLIS) Country Profile indicators Intrepretation Guide World health Organization 2010.
  5. Ministry of Women and Child Development, Government of India. POSHAN Abhiyaan (National Nutrition Mission). Ministry of Women and Child Development, Government of India. 2019.
  6. Ministry of Women and Child Development, Government of India. PM launches National Nutrition Mission, and pan India expansion of Beti Bachao Beti Padhao, at Jhunjhunu in Rajasthan. Press Information Bureau. 2018.
  7. WHO, UNICEF. The extension of the 2025 maternal, infant and young child nutrition targets to 2030. World Health Organization. 2018.
  8. Stanly AM, Samya V. Prevalence of Undernutrition Among Under 5 Children in A Rural Area. Indian J App Res. 2015;10(5)207-9.
  9. Yadav SS, Yadav ST, Mishra P, Mittal A, Kumar R, Singh J. An Epidemiological Study of Malnutrition Among Under Five Children of Rural and Urban Haryana. J Clinic Diagnos Res. 2016;10(2)7-10.
  1. Sukla P, Borkar A. Nutritional status of pre-school children (1-5 years) in rural area of Chhattisgarh state. Int J Community Med Public Health. 2018;5(5)2099-2103.
  2. Mamulwar MS, Rathod HK, Jethani S, Dhone A, Bakshi T, Lanjewar B, et al. Nutritional status of underfive children in urban slums of Pune. Int J Med Public Health. 2014;4(3)247-252.
  3. Islam S, Mahanta TG, Sarma R, Hiranya S. Nutritional status of under 5 children belonging to tribal population living in riverine (Char) areas of Dibrugarh district, Assam. Indian J Community Med. 2014;39(3)169-174.
  4. Radhamani KV, Rajeev SV. A study on nutritional status of Anganwadi children in a rural area of North Kerala. Indian J Child Health. 2017;4(3)348-351.
  5. Vasudevan K, Udayashankar C. Nutritional status of children under five years of age in a rural area of Pondicherry. Int J Contemp Med Res. 2019;6(4)1-3.
  6. Anandi BS, Reddy SB, Indupalli AS. Assessment of Nutritional Status among Under Five Children in a Rural Area of Kalaburagi District. Natl J Community Med. 2018;9(8)599-604.
  7. Singh H, Gupta A, Sachdeva A, Baral lD, Kumar D, Singh S. Nutritional Status of 1-5 years Children in a Hilly Tribal District of North India. Int J Contemp Med Res. 2016;3(11)3286-3288.
  8. Chakravarthy KB, Soans SJ, Hanumanth N. Nutritional Status of Under Three Children in South India – A Cross Sectional Study. Int J Med Sci Clinic Invent. 2015;2(3)809-815.
  9. Prinja S, Sharma A, Tripathy JP, Rana SK, Aggarwal AK, Dalpath SK. Inequalities in nutritional status among under five children in Haryana state, India- Role of social determinants. Indian J Comm Health. 2017;29(1)81-88.

  1. Mathur A, Tahilramani G, Makhija S, Devgan V. Burden of Severe Acute Malnutrition in under five Children (2–59 Months) Admitted in a Tertiary Care Hospital of Delhi. J Trop Pediatr. 2018;64(1)45-50.
  2. Gupta R, Chakrabarti S, Chatterjee SG. A Study to Evaluate the Effect of Various Maternal Factors on the Nutritional Status of Under-Five Children. Indian J Nutri. 2016;3(2)149.
  3. Purohit L, Sahu P, Godale LB. Nutritional status of under- five children in a city of Maharashtra- a community-based study. Int J Community Med Public Health. 2017; 4(4)1171-1178.
  4. atel P, Gandhi SJ, Vachani P, Bhimani N. Factors related to under nutrition among children in a rural area in Patan district of Gujarat, India. Int J Community Med Public Health. 2019;6(1)142-145.
  1. Tiwari SR, Bandi JR, Awasthi SR, Sharma AK. Assessment of prevalence of protein energy malnutrition in under 5-year children in an urban slum of Mumbai, India and to study associated factors. Int J Community Med Public Health. 2016;3(5)1129-1134.
  2. Sarkar S. Cross-sectional study of child malnutrition and associated risk factors among children aged under five in West Bengal, India. Int J Popul Stud. 2016;2(1)89-102.
  3. Upadhyay RP, Chinnakali P, Bhilwar M, Krishnan B, Kulkarni V, Gupta A, Rizwan SA. Prevalence of malnutrition, acute respiratory infections and diarrhoea in children aged 1-5 years in urban slums of Puducherry, South India. Int J Contemp Pediatr. 2015;2(1)37-41.
  4. Ministry of Women and Child Development, Government of India. POSHAN Abhiyaan (National portal of India). Available at: