E-ISSN:2349-4166
P-ISSN:2349-4158

Research Article

Child Health

Public Health Review - International Journal of Public Health Research

2014 Volume 1 Number 2 July-September
Publisherwww.medresearch.in

Reproductive and Child Health Programme in Bihar, India: Does Expenditure Matters to Performance?

Kumar A.1*
DOI: https://doi.org/10.17511/ijphr.2014.i2.01

1* Amit Kumar, International Institute for Population Sciences, Mumbai, Maharashtra, India.

Since the launch of the reproductive and child health policy regime in 1998-99, there has been a massive rise in government expenditure on family welfare programmes in Bihar and national level. This paper makes a systematic effort to assess the performance of the family welfare programmes vis-à-vis trends in expenditure. The trends in key performance indicators for Bihar reveal that progress has been slow and limited in the post-RCH policy regime. Contraceptive prevalence coverage has accelerated, and the increased in the Child immunization and institutional delivery. Consequently, the pace of reduction in the couple protection rate, total fertility rate and infant mortality rate has slowed. It is evidently clear that in the absence of suitable mechanism to operationalise of RCH programme, the exponential increase in expenditure alone cannot lead to commensurate a positive impact on key performance and outcome indicators. There is need suitable mechanism to operationalise RCH programme.

Keywords: Child health, Expenditure, Family Planning, Performance, Reproductive Health

Corresponding Author How to Cite this Article To Browse
Amit Kumar, International Institute for Population Sciences, Mumbai, Maharashtra, India. Kumar A. Reproductive and Child Health Programme in Bihar, India: Does Expenditure Matters to Performance?. Public Health Rev Int J Public Health Res. 2014;1(2):45-60.
Available From
https://publichealth.medresearch.in/index.php/ijphr/article/view/7

Manuscript Received Review Round 1 Review Round 2 Review Round 3 Accepted
2014-10-11 2014-10-15 2014-10-27 2014-11-12
Conflict of Interest Funding Ethical Approval Plagiarism X-checker Note
No Nil Yes 7%

© 2014 by Amit Kumar and Published by Siddharth Health Research and Social Welfare Society. This is an Open Access article licensed under a Creative Commons Attribution 4.0 International License https://creativecommons.org/licenses/by/4.0/ unported [CC BY 4.0].

Introduction

The family planning programme in India is both unique and first of its kind in the world. Since its historic initiation in 1951, the programme has changed in terms of policy intended and stated approach to actual programme implementa­tion. The programme has evolved in terms of varied approaches from the clinic approach mode during 1952-61 to the current reproductive and child health (RCH) approach. The RCH approach was rolled out on an experimental basis in 1995 and formally launched in 1997. This strategic shift in the programme approach resulted from the recommendations at the International Conference on Population and Development in Cairo by the United Nations in 1994, and India was a signatory to the programme of action (POA).

In the aftermath of the ICPD, the existing national programme of family planning/welfare seeking to achieve predetermined demographic goals of low fertility and population stabilization were considered to centralized and anti-feminist. This modifica­tion of the programme in accordance with ICPD recommenda­tions was formally termed as the Target Free Approach (TFA) [1]. In this approach, all predetermined targets were removed, and it was recommended that all programmes aimed to improve the health of women and children must be implemented as a part of an integrated package of services to meet the reproductive health needs and rights of women [2].

Since the launch of the RCH programme in India, there have been persistent and often contentious debates among the population and health experts over its “successful implementation” in developing countries. Critics have raised doubts as to how these concepts will be operationalized in patriarchal societies like India with male-dominated, hierarchical services delivery systems. Some of the earlier studies that examined the implications of the new approach to family welfare indicators mostly addressed method­ological problems [3] [4] [5] [6]. How­ever, there has not been a serious evidence-based comparative assessment of the proportionate rise in expenditure versus the performance of RCH approach under family welfare programme.

In an earlier attempt of reviewing RCH programme in India, we found that since 1997, the expenditure incurred on the RCH programme, increased substantially compared with the pre-RCH regime [2].

This is on an account of the steep rise in planned allocation and possible loans which were liberally made available by the World Bank. Under the broad umbrella of the RCH pro­gramme, which includes maternal and childcare services, family planning and immunization programme, the government expenditure has been more than doubled compared with pre-RCH policy regime. Nevertheless, stated disturbingly as a matter of fact, the contraceptive prevalence rate has been practically stall­ing and fertility levels have been either decelerating or on the drag in Bihar [7].

An assessment of the program’s performance during the first years of TFA (1996-97) is available for four large, traditionally poor performing states, namely Bihar, Madhya Pradesh, Rajasthan and Uttar Pradesh [8]. According to data released by the Department of Family Welfare, Government of India, with the exception of Rajasthan (which followed an alternative Vikalp frame work for RCH), the performance of the family planning program during 1996-97, as compared to previous years (1995-96), declined in all these states. During this period, the number of sterilization, IUD acceptors, oral pill users and condom users increased in Rajasthan, but in all other states it recorded the declining trend [9]. One of the consequences of the above factors seems to be that the couple protection rate has been practically fluctuating since 1997 in Bihar. As one keen observer had aptly put, it has been “a saga of great expectations and poor performance” [10].

The overly optimistic demographic goals that have been set in various planned documents have been continuously put off to the extent that such statements now fail to enthuse anyone. The National Population Policy launched in 2000 has the medium term objective to achieve the replacement level fertility and Millennium Development Goals (MDG) 4, 5 & 6 by 2010 [11]. This also envisages states to bring their own policies, giving priority to local issues in coherence with the goals and objectives prescribed in the national policy. Henceforth, several states have brought out their own policies to attain the replacement level fertility and MDGs within a rational time frame and the prevailing socio-economic status of the people. According many of the state achieved the replacement level of the fertility, but the condition is worse in Bihar while budget allocation has been continuously proportionate increased over the period for achieve to made targets and goals.


This is a very disturbing fact, no consistence relation between expenditure and performance of reproductive health programmes.

In this context, our objective in this paper is to pursue a more comprehensive examination of comparative trends in expenditure on family welfare programme vis-à-vis performance in pro­gramme-related indicators for Bihar. Such continuing assessment is critical in terms of policy review, reorientation and action. We revisit the recent changes in family welfare programme and examine if the quan­tum increase in family welfare expenditure has been effective in contributing recognizable change in terms of key RCH and family planning performance indicators for Bihar.

Data and Method

We have used multiple data sources in this study to assess expenditure on family welfare versus family planning and RCH programme performance for Bihar. First, The recently completed National Family Health Survey-3 (NFHS-3) conducted during 2005-06 has been exemplary in the rapidity with which the survey findings have been brought out at the national and state levels in elegantly prepared series of fact sheets [12].

The survey is the third in the NFHS series of surveys which provide information on population, health and nutrition in India as a whole and each of the 29 states. NFHS-2 was conducted during 1998-99 and NFHS-1 in 1992-93[13] [14]. NFHS-3 interviewed a random sample of 1, 09,041 households. It provides trend data on key indicators and includes information on several new topics, such as HIV/AIDS-related behavior and the health of slum populations.

We have used the data available from NFHS-3 fact sheets to compare the trends in the post-1998 period with the pre-1998 period by comparing the estimates of NFHS-3 and NFHS-2, to assess the magnitude of change in the post-1998 period and NFHS-2 and NFHS-1 to assess the pre- 1998 period. This is possible because the 1998-99 survey can be considered the dividing line of the pre- and post-RCH approach.

The annual change in percentage points in the post-1998 period is compared with similar changes in the pre-1998 period. Only those indicators for which data were available in all the three points of time, 1992-93 (NFHS-1), 1998-99 (NFHS-2) and 2005-06 were used for this study.

Such information was available for 30 indicators: 8 on “marriage and fertility”; 10 on “family planning” comprising “contraceptive use” (7) and “unmet need” (3); 12 on “maternity and childcare” comprising “maternity care” (3), “child immunization” (5), “treatment of childhood diseases” (2) and “child feeding practices” (2). Table 1 provides data on these indicators at the state level as available from the NFHS-3 survey to indicate the current situation in Bihar.

Second, we have compiled family welfare expenditure data and couple protection rate data from the statistics released by the Family Welfare Programme in India, Year Books for different years [15]. Third, demographic indicators – total fertility rate (TFR) and infant mortality rate (IMR) for different years (1985 to 2008) used data from Registrar General of India, Sample Registration System [16].

Family Welfare Expenditure in Bihar

Programme cost for family welfare programmes met by the central government, national and international donors; and international bi-lateral support. Figure1 shown that trends of expenditure of family welfare (not adjusted for consumer price index) in Bihar during 1985-86 to 2007-08. From the figure, it is evident that expenditure from pre to post-RCH period is increasing. This is mainly because of the introduction of programmes like RCH in 1997 and NRHM in 2005, which are bringing bulk of central government funds into family welfare programme. As against pre-RCH (before 1997-98) period there is an excess over expenditure in the post-RCH period (after 1997-98).

Fig: 1 Trends of expenditure of family welfare programme in Bihar (1985-86 to 2007-08)

public_07_01.jpg

Source: Expenditure data compiled from the statistics released by the Family Welfare Programme in India, Year Book, MoHFW, Government of India

The family welfare expenditure was 31 percent during pre RCH (1985-97) of total expenditure (expenditure of 1985-2008). However, this expenditure increased 69 percent during post RCH (1998-2008) of total expenditure in Bihar.


This increase is obvious due to heavy flow of international donor aids along with the increase of domestic funds to family welfare programme after the introduction of RCH program in 1997 (Figure 2).

On an average, the trends of family planning expenditure marked a huge increase in funds for the family welfare program in Bihar after the introduction of RCH and NRHM schemes under family welfare program. The present paper made an attempt to understand whether the increasing expenditure and policy strategy did bring any noble changes in performance of selected indicators of family planning programme Bihar.

Fig: 2 Percentage of family welfare expenditure of pre-RCH and post-RCH era of total expenditure in Bihar (1985-2008)

public_07_02.jpg

Source: Expenditure data compiled from the statistics released by the Family Welfare Programme in India, Year Book, MoHFW, Government of India,

Post- and Pre-1998 Periods

Comparison of Post- and Pre-1998 Periods

Table 1 provides for the country as a whole a comparative profile of the 29 parameters for which data were available in all the three rounds of

NFHS surveys: 1, 2 and 3. The annual change in the percentage values observed during 1998-99 and 2005-06 computed from NFHS-2 and 3 data and between 1992-93 and 1998-99 obtained from the NFHS-1 and 2 data are also given. The last column of the table also provides a summary picture whether the post-1998 changes were worse off (slow down in progress) than the pre-1998 changes; “yes” indicating that the pace of change post-1998 is worse off and “no” implying the opposite. It is remarkable to note that in most of the variables, in 17 out of 30, the pace of improvement during 1998-2005 has slower than the pace of improvement during the period 1992-1998. TFR, Median age at first birth, percentage women of less than three birth order and women no want more children one son and one daughter show that the pace of improvement was slower during 1998-2005 than the pace of improvement during the 1992-1998 period. For example take the case of the percentage women of less than three birth order has increased 0.07 annual percentage point in pre 1998 compared 0.03 point in post 1998. In the case of median age at first birth has declined 0.02 annual percentages in 1992-98 rather than 0.01 point annual percentage declined in 1998-2005. Women no want more children one son and one daughter marginal increases in annual percentage point during pre 1998 period compared post 1998 period. Interestingly, we found that total fertility rate annual percentage declined -0.09 point in 1992-1998 while annual percentage increased 0.07 point during 1998-2005.


Table 1: Annual Change in Marriage and Fertility, Family Planning and Maternal and Child Health during Pre- and Post-1998, Bihar

Selected Indicators of marriage, fertility, family planning and maternal-child health NFHS-3 NFHS-2 NFHS-1 Annual Change (Per Cent Points) Annual Change
(2005-2006) (1998-1999) (1992-1993) 1998-2005 1992-1998 (1992-1998)>(1998-2005)
Marriage and Fertility
Women age 20-24 married by age 18 (per cent) 60.3 71.9 74.4 -1.66 -0.42 No
Total fertility rate (children per woman) 4.0 3.49 4.0 0.07 -0.09 Yes
Median age at first birth for women age 25-49 18.7 18.8 18.9 -0.01 -0.02 Yes
Percentage of women with birth order less than three 45.4 45.3 43.6 0.01 0.28 Yes
Married women with 2 living children wanting no more children (per cent) 60.2 41.8 25.9 2.63 2.65 Yes
Two sons 77.4 58.8 71.5 2.66 -2.12 No
One son, one daughter 67.5 43.7 22.8 3.4 3.48 Yes
Two daughters 20.0 10.8 6.9 1.31 0.65 No
Family Planning (currently married women, age 15-49)
Any method (per cent) 34.1 24.5 23.1 1.37 0.23 No

Any modern method (per cent) 28.9 22.4 21.6 0.93 0.13 No
Female sterilisation (per cent) 23.8 19.2 15.1 0.66 0.68 Yes
Male sterilisation (per cent) 0.6 1.0 0.6 -0.06 0.07 Yes
IUD (per cent) 0.6 0.6 0.5 0.00 0.017 Yes
Pill (per cent) 1.3 1.2 1.0 0.01 0.03 Yes
Condom (per cent) 2.3 0.7 1.3 0.23 -0.1 No
Total unmet need (per cent) 23.1 24.5 25.8 -0.2 -0.22 Yes
For spacing (per cent) 10.7 12.6 14.4 -0.27 -0.3 Yes
For limiting (per cent) 12.1 11.9 10.6 0.03 0.22 No
Maternal and Child Health
Mothers who had at least 3 antenatal care visits for their last birth (per cent) 17.0 16.1 15.0 0.13 0.18 Yes
Births assisted by a doctor/nurse/LHV/ANM/other health personnel (per cent) 30.9 24.8 18.9 0.87 0.98 Yes
Institutional births (per cent) 22.0 14.8 12.1 1.03 0.45 No
Children 12-23 months fully immunised (per cent) 32.8 11.6 10.7 3.03 0.15 No
Children 12-23 months who have received BCG (per cent) 64.7 37.7 33.9 3.86 0.63 No
Children 12-23 months who have received 3 doses of polio vaccine (per cent) 82.4 42.2 31.6 5.74 1.77 No
Children 12-23 months who have received 3 doses of DPT vaccine (per cent) 46.1 24.9 29.1 3.03 -0.7 No
Children 12-23 months who have received measles vaccine (per cent) 40.4 16.6 14.6 3.4 0.33 No
Children with diarrhoea in last 2 weeks who received ORS 20.9 15.4 10.5 0.79 0.82 Yes
Children with diarrhoea in last 2 weeks taken to health facility 53.9 50.3 46.7 0.51 0.6 Yes
Children breastfed within one hour of birth 3.7 5.4 1.5 -0.24 0.65 Yes
Children who are underweight 55.9 54.3 62.6 0.23 -1.38 Yes

Data Sources: National Family Health Survey-1992-93, 1998-99, & 2005-06

We move on performance of family planning indicators, it reveals that slow increased in female sterilization, male sterilization, IUD and pill in pre 1998-99, bout greater than post 1998-99. Moreover, unmet need and for spacing method unmet need has more declined in pre 1998 period compared post 1998 period. For instance, take the case IUD has increased 0.17 point annual percentage in 1992-1998 while no annual changes in 1998-2005 and followed by female stylization 0.66 point annually increased in 1992-1998 period while 0.68 point annually increased until 2005. Further, male sterilized 0.07 point annually increased in 1992-1998 while 0.06 point annually declined in 1998-2005; the unmet need for contraception (spacing and limitation) declined by 0. 22 points annually during 1992-1998 and this slowed down to 0.2 points during 1998-2005.

Now turn on indicators of maternal and child health, At least 3 Antenatal care visit (ANC), birth assisted by trained health professionals, diarrhoea children who received ORS, children breast feeding within one hour of birth and underweight children have given good performance in pre 1998 period compared post 1998 period.

For example, in the case of at least 3 ANC, 0.18 points increased annual percentage in 1992-1998 and 0.13 points increased in annual percentage in 1998-2005. Similarly, this increased of annual percentage point 0.98 points in 1992-1998 while the annual percentage point was 0.87 in 1998-2005. Moreover, diarrhoea children who received ORS has increased annual percentage point 0.82 in pre 1998 period, while implying an annual percentage point increase of 0.79 points in the post-1998 period. This implies that the treatment of diarrhoea at the health facility has increased 0.6 points in 1992-1998 while 0.51 point increased in 1998-2005. Surprisingly, the increased in the percentage of children breast fed within one hour after birth was annually percentage points 0.65 during 1992-98 and this declined to 0.24 points post-1998 until 2005. Similarly, the percentage of underweight children declined by 1.38 points annually during 1992-98 while 0.23 points annually increased during 1998-2005.

Family Welfare Expenditure versus Outcomes

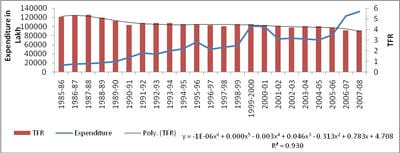
In this section, the progress in two vital programme outcome indicators IMR, TFR and CPR are accessed vis-à-vis the rise in family welfare expenditure. For In, it is evident from Figure 3 that the decline in TFR was not appreciable in comparison to the heavy increase in expenditure.


Figure 3 shows that there has been a steady increase in the expenditure from 1985-86 onwards till 1995-96 and thereafter declined in the expenditure till 1996-97. Further in the rate of expenditure increased during 1996-97 to 1999-2000. After that again expenditure declined till 2004-05. Moreover, once again onward grow up in expenditure during 2004-05 to 2007-08.

Fig: 3 Trends of Family Planning Expenditure and Total Fertility Rate in Bihar (1985-86 to 2007-08)

public_07_03.jpg

Source: Expenditure data compiled from the statistics released by the Family Welfare Programme in India, Year Book, MoHFW, Government of India, and Total Fertility Rate Data from the Sample Registration System of India.

However, the family fare expenditure increased over the period especially post-RCH (after 1998). After the introduction of RCH approach, TFR has slowed down compared of the increase in expenditures. Also, in the subsequent years, the decline in TFR was not remarkable in spite increasing family planning expenditures over the period. On the other hand, TFR has declined 17 percent in the pre-RCH period (pre 1998), and 9 percent declined post-RCH period (after 1998).

Fig: 4 Trends of Family Planning Expenditure and Infant Mortality Rate in Bihar (1985-86 to 2007-08)

public_07_04.jpg

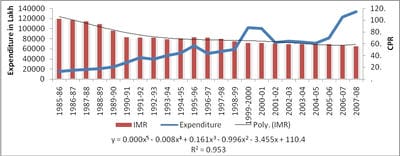
Source: Expenditure data compiled from the statistics released by the Family Welfare Programme in India, Year Book, MoHFW, Government of India, and Infant Mortality Rate Data from the Sample Registration System of India. It is evident from Figure 4 that the decline in IMR was virtually absent

between 1991-92 and 1995-96, although the family welfare expenditure increased moderately during the same period. In post-1998-99, the expenditure has increased dramatically, while the decline in IMR has been slowdown. Overall, the massive increase in expenditure during 1998-99 has failed to bring commensurate decline level of IMR in the post-RCH policy regime. Especially since 2004-05, the expenditure trend line and infant mortality rate appeared to be parallel to each other.

Fig: 5 Trends of Family Planning Expenditure and Couple Protection Rate in Bihar

public_07_05.jpg

Source: Expenditure and Couple Protection Rate data compiled from the statistics released by the Family Welfare Programme in India, Year Book, MoHFW, Government of India.

IMR has decreased higher in the pre-RCH period in preference post-RCH period. Moreover, over all around 45 percent declined in IMR during 1985 to 2007.The expenditure has increased with fluctuation. Nevertheless, it is visible in that incompatible relation between expenditure together with IMR.

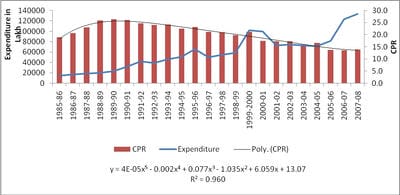
The increase in family planning expenditure did not have any positive impact on Couple Protection Rate (CPR). After 1998-99 CPR has shown little or no improvements in spite of the fact that expenditures increased remarkably in family planning programme (Figure 4). CPR has increased till 1989, thereafter CPR has fluctuated with decline continuously while expenditure has increased after 1989. Interestingly, expenditure has increased 88 percent during 1985 to 2007, but 35 percent negatively declined in 1985 to 2007, while it should be increased with increased expenditure.

Also it evident clear spport of my finding, government supported audit committee report (Audit Report No.3 2001) revealed that sterilizations programme declined or remained static after adopting TFA. According NFHS-3 Report, the percentage of female sterilization accounts for 70


percent (2005-06) of all contraceptive use, down from 79 percent at the time of 1998-99. The IEC activities generally declined during 1995-2000 and were not consistently carried out in the all states/UTs. The performance of spacing methods also declined. The number of IUD acceptors was 269889 in 1995-96 which was dropped the number of acceptors 126882 in 1998-99 among women age 15-45. However in the same period, in spite of marked rise in expenditure but CPR did not increase.

Family Welfare Expenditure versus Key Performance Indicators

This section has examined the linkages between family welfare expenditure and selected RCH and family planning indicators in Bihar. Effort has been made to understand how far the increase in expenditures in the post-RCH era, has effectively contributed to improvements in the selected family planning and RCH indicators.

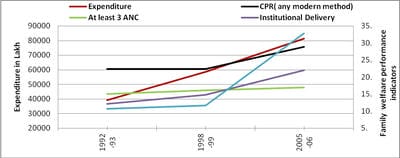
Figure 6 shows a rapid increase in expenditure in the post-RCH period compared with the pre-RCH period, but the progress in selected indicators fail to indicate a significant improvement. When did comparable analysis between expenditure and key performance indicators (full immunisation and CPR (any modern method), institutional delivery & least 3 ANC), we found that family welfare expenditure has increased twofold during pre-RCH to post-RCH era. By comparison, in case of full immunisation and CPR (any modern method), the performance has accelerated in the post-RCH period than Pre-RCH, followed by institutional delivery slowed the increase in post-RCH. Interestingly, it is visible that at least 3 ANC has increased slightly more in the pre-RCH era rather than in the post-RCH era. Over all, clear slowdown in at least 3 ANC has slowed the increase in during pre-RCH to post-RCH period.

Fig-6: Trends in Family Welfare Expenditure (in lakhs) and Selected Performance of Indicators for Bihar (1992-93 to 2005-06)

public_07_06.jpg

Source: Expenditure data compiled from the statistics released by the Family Welfare Programme

in India, Year Book, MoHFW, Government of India, and selected performance indicators from National Health Survey-1, 2 & 3.

However, progress in the full immunization and CPR (any modern method) and institutional delivery coverage was comparatively better in the post-RCH period. On the whole, the massive increase in family welfare expenditure could not result in a matching or significant impact on at least 3 ANC and institutional delivery.

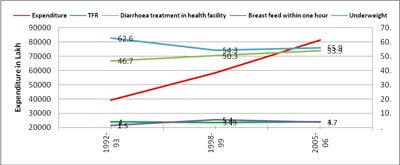
Fig-7: Trends in Family Welfare Expenditure (in lakhs) and Selected Performance of Indicators for Bihar (1992-93 to 2005-06)

public_07_07.jpg

Source: Expenditure data compiled from the statistics released by the Family Welfare Programme in India, Year Book, MoHFW, Government of India, and selected performance indicators from National Health Survey-1, 2 & 3.

Figure 7 reveals that a speedy increase in expenditure in the post-RCH period compared with the pre-RCH period, but the progress in selected indicators like TFR, Breast feeding within one hour and underweight totally fail to indicate a significant improvement. In spite, the increase in expenditure in the post-RCH period was two times more than that in the pre-RCH period.

Surprisingly, accordingly past trend TFR should be decline in post-RCH but it has increased while TFR has declined during pre-RCH. In case of underweight has declined 62 percent to 54 percent in the pre-RCH period, while 54 to 55 increased in post-RCH. Further comparison in case of children diarrhoea taken to the health facility, the performance has accelerated in pre-RCH then Post-RCH. Furthermore, interestingly finding revealed that Breast feeding within one hour has increased in pre-RCH while clear slowdown in post-RCH.

However, progress in the TFR, Breast feeding within one hour and underweight was comparatively better in the post-RCH period. On the whole, the massive increase in family welfare expenditure could not result in a matching or significant impact on TFR,


Breast feeding within one hour, children diarrhoea taken to the health facility and underweight

Situation of Health Infrastructure

Although the state has a fairly extensive network of public health facilities it remains grossly inadequate compared to the Government of India (GoI)/Government of Bihar (GoB) norms. Furthermore, even the existing facilities lack the basic minimum infrastructure needed for their optimal functioning.

Table 2: Health Infrastructure of Bihar

Item Required In position Short- fall Percentage of Shortfall
Sub-centre 14959 8858 6101 40.8
Primary Health Centre 2489 1641 848 34.1
Community Health Centre 622 70 552 88.7
Multipurpose worker (Female)/ANM 10499 9127 1372 13.1
Health Worker (Male) MPW(M) at Sub Centres 8858 1074 7784 87.9
Health Assistant (Female)/LHV at PHCs 1641 479 1162 70.8
Health Assistant (Male) at PHCs 1641 634 1007 61.4
Doctor at PHCs 1641 1565 76 4.6
Obstetricians & Gynaecologists at CHCs 70 21 49 70.0
Physicians at CHCs 70 38 32 45.7
Paediatricians at CHCs 70 17 53 75.7
Total specialists at CHCs 280 104 176 62.9
Radiographers at CHCs 70 15 55 78.6
Pharmacist at PHCs & CHCs 1711 439 1272 74.3
Laboratory Technicians 1711 135 1576 92.1
Nurse/Midwife at PHCs & CHCs 2131 1425 706 33.1

(Source: RHS Bulletin, March 2008, M/O Health & F.W., GOI) (Bihar)

According to information available with the state directorate, only 23 of the 38 districts in the state have a district hospital. Similarly, of 101 sub-divisional headquarters, only 23 have a sub-divisional hospital. The Community Health Centre (CHC)/ Referral Hospital Network are virtually nonexistent with the state having only 101 CHCs/Referral Hospitals (70 functional). The state has only 398 Primary Health Centre (PHC) that suggest that each PHC covers an average of 2 lakhs population as against the norm of 30,000.

A similar situation prevails with regard to facilities at the Health Sub-Centre (SC) level, where the state has 9140 Health SCs i.e. an average of one Health SC for a population of 9000 as against the norm of 5000 [17]. Despite the fact that expenditure of family welfare programme has increased from 14920 lakhs in 1985-06 to 133175 lakhs in 2007-08. This sharp increase in budget estimate could be due to the loans on this programme liberally made available from the World Bank to strengthen the additional RCH components. When look at health infrastructure and human resources, we found that all indicators of health infrastructure suffering from shortfall in table 2. For example, maximum shortfall 92 percentage in Laboratory Technician, followed by 88 percent in CHCs, 87 percent in Male Multi-Purpose Worker (MPW) at Sub Centres, 78 percent in Radiographers at CHCs, 74 percent Pharmacist at PHCs & CHCs, and 70 percent in Health Assistant (Female)/ Local Health Visitor (LHV) at PHCs. Doctor at PHCs of shortfall is 4 percent, followed by 13 percent shortfall of MPW (Female) / Auxiliary Nurse Midwife (ANM).

Table-3: Public Health Personnel

Category IPHS Standard Required Sanctioned Existing Gap
Medical Officers 1 Per 10000 Population 9500 5124 3860 516
ANM 1 Per 2500 Population 38500 11294 10055 17151

Source- (Status of Health in Bihar, 2009), Indian Public Health Standard (IPHS)

When we talk about situation of health personnel according Indian Public Health Standard (IPHS), the situation is worst in Bihar. Table 3 revealed that a large gap between required, sanctioned and existing among medical officer and ANM. Furthermore, gap of 516 positions in medical officers and large gap 17151 in position of ANM.

Conclusions

In this study, a meticulous effort has been made to determine the effect of the massive increase in family welfare expenditure on key family planning, RCH performance and demographic outcome indicators for Bihar in different stages of health transition. A comparative analysis of evidence during the pre- and post-RCH policy regimes revealed that expenditure on family welfare programme has more than doubled during the post-RCH policy regime.


This is a very disturbing fact, has incurred more than double the expenditure during 1998-2005 compared to 1992-98. This is possibly because of the loans on this programme liberally made available from the World Bank to strengthen the additional RCH components and could be due to heavy flow of international donor aids along with the increase of domestic funds to family welfare programme after the introduction of RCH program in 1997. Instead, the health infrastructure and human resources has been suffering from shortage situation. Without a better health infrastructure and health resources, we could not achieve a good health status through any programme.

However, some variable patterns are noted in expenditure allocations. The magnitude of expenditure has proportionate increased over the period. In the subsequent years, the performance of programme indicators like TFR, IMR and CPR was not remarkable in spite increasing family planning expenditures over the period. The increase in family planning expenditure did not have any positive impact on Couple Protection Rate (CPR). While the expenditure on family welfare programme has increased swiftly, expenditure on services and supplies which have a direct bearing on key maternal and child health outcome indicators has not kept pace with the overall increase in expenditure for Bihar. The RCH programme approach did not suggest evidence of significant and anticipated effect on any of the selected programme indicators.

However, the systematic comparison of progress in family welfare expenditure and its corresponding improvement in performance indicators demonstrate that the integration of the RCH approach with family welfare programme in the absence of the revised framework of goals (rather than targets) resulted in limited progress in family welfare indicators. It is possible that the proposed integration under the programme is not understood in its spirit and purpose. Compared with the separate well defined programmes implemented earlier, the RCH approach seems greatly promotion-driven lacking in operational framework with clearly articulated new strategies of programme implementation.

There appears to be less integration between different programmes that are supposed to be coming into force when they are implemented under one category. It is evidentially clear that in the absence of suitable mechanism to operationalise

RCH approach under the integrated banner of family welfare programme, the exponential increase in expenditure alone cannot lead to commensurate a positive impact on key performance and outcome indicators.

There is a need to examine in detail how the RCH budget is really spent and why the expected pace of improvements in various RCH indicators are not achieved. This is a matter of serious concern for policymakers and programme administrators. There appears to be no synergy between different programmes that is supposed to come into force when they are implemented under one umbrella. The RCH umbrella seems to be leaking, as indicated by the overall slowdown in key indicators.

Reference

  1. Government of India. Manual on Target-free Approach in Family Welfare Programme. Ministry of Health and Family Welfare, Government of India, New Delhi. 1996.
  2. Srinivasan K, Chander Shekhar, P Arokiasamy. Reviewing Reproductive and Child Health Programmes in India. Economic & Political Weekly. 2007;42(27)2931-39.
  3. Salunke S, Narvekar S. Target free Approach for Family Welfare- A Review of Experiences in Maharashtra. Government of Maharashtra. 1997.
  4. Kothari D, et al. Vikalp– Managing the Family Planning Programme in the Post-ICPD Era- An Experiment in Rajasthan, India. IIHMR Occasional. 1997;Paper No 2.
  5. Ghasura ND, Patel BC, ME Khan. Case Study- Implementing Target-free Approach in Gujarat. National Workshop on Target-Free Approach, Lucknow. 1997;24-25.
  6. Mavalankar DV. Paradigm Shift in India’s Family Welfare Programme- A Review of Target- Free Approach in Family Planning, unpublished document. Indian Institute of Management, Ahmedabad;1997.

  1. Department of Health. Status of Health in Bihar. Government of Bihar. 2009.
  2. Sangwan N, Maru RM. The Target-Free Approach- An Overview”. Journal of Health Management. 1999;1(1)71-96.
  3. Ministry of Health and Family Welfare (MoHFW). National Health Accounts 2001-02, National Health Accounts Cell. Ministry of Health and Family Welfare, Government of India, New Delhi. 2005.
  4. Srinivasan K. Population policies and family planning programmes in india- a review and recommendations”. International Institute For Population Sciences, Mumbai. 47(1-2)Jan 2006.
  5. National Population Policy. Department of Family Welfare, Ministry of Health and Family Welfare. Government of India. 2000.
  6. IIPS and Micro-International. National Family Health Survey (NFHS 3), 2005-06. International Institute for Population Sciences, Mumbai. 2007.
  1. IIPS and Micro-International. National Family Health Survey (NFHS 2), 1998-99. International Institute for Population Sciences, Mumbai. 2000.
  2. IIPS and Micro-International. National Family Health Survey (NFHS 1), 1992-93. International Institute for Population Sciences, Mumbai. 1993.
  3. Ministry of Health and Family Welfare (MoHFW). Family Planning Year Book, 1986-2006, Ministry of Health and Family Welfare. Government of India, New Delhi. 2007.
  4. India Office of the Registrar General & Census Commissioner. Compendium of India's Fertility and Mortality Indicators, 1971-2007- Based on the Sample Registration System (SRS). Registrar General, India. 2009.
  5. Madhav DG. PHC in Rural Bihar- Gaps in Infrastructure and Service Delivery. (G L Forgia, Ed) India Health Beat. 2010;3(6); 4.