E-ISSN:2349-4166
P-ISSN:2349-4158

Research Article

Disease

Public Health Review - International Journal of Public Health Research

2017 Volume 4 Number 5 October-December
Publisherwww.medresearch.in

Cardiovascular Disease (CVD) Risk estimation among 40 years and older using WHO/ISH risk prediction charts

Singh G.1*, S Nanda G.2, Singh H.3
DOI: https://doi.org/10.17511/ijphr.2017.i5.05

1* Gurpreet Singh, Station Health Organisation, Jalandhar, Punjab, India.

2 Gurprit S Nanda, Professor, Department of Community Medicine, Punjab Institute of Medical Sciences, Jalandhar, Punjab, India.

3 Harinder Singh, Department of Community Medicine, Punjab Institute of Medical Sciences, Jalandhar, Punjab, India.

Introduction: Evidence based programme to reduce fatal/non-fatal CVDs can be formulated using WHO/ISH risk prediction charts. Use of combined risk approach is effective in identification of individuals requiring intervention. Objective: To determine 10 year cardiovascular risk and prevalence of selected risk factors for CVDs among 40 years and older population in an urban field practice area of a medical college. Material and methods: This was a cross sectional study conducted with sample size of 116. Inclusion criteria was age >40 years and without CVDs. WHO/ISH risk charts were used. Pilot tested, structured, interview based questionnaire was administered followed by clinical examination to determine prevalence of selected CVD risk factors in the community. Results: Mean age was 56.23 + 10.6 years and majority (74.1%) were females. High 10 year risk of cardiovascular events, family history of CVDs, high BMI, increased risk of metabolic complications, abdominal obesity, hypertension and smoking was seen in 23%, 33.6%, 79.3%, 44.8%, 52.6%, 56.9% and 10.3% respectively. Significant gender difference was seen in prevalence of smoking, physical inactivity, overweight, increased risk of metabolic complications, and abdominal obesity (p= 0.044, 0.036, 0.000, 0.000, and 0.001 respectively). Higher prevalence of Hypertension, Diabetes, abdominal obesity, overweight, and smoking was found in individuals at high 10 year risk of CVD event. Conclusion: The present study document high 10-year risk of cardiovascular events and prevalence of risk factors. Identification of individuals at high risk of CVDs is crucial to mitigate rapidly growing CVD burden in the country.

Keywords: Cardiovascular risk, Body Mass Index, Waist Circumference, Diabetes, Hypertension

Corresponding Author How to Cite this Article To Browse
Gurpreet Singh, , , Station Health Organisation, Jalandhar, Punjab, India.
Email:
Singh G, Nanda GS, Singh H. Cardiovascular Disease (CVD) Risk estimation among 40 years and older using WHO/ISH risk prediction charts. Public Health Rev Int J Public Health Res. 2017;4(5):134-140.
Available From
https://publichealth.medresearch.in/index.php/ijphr/article/view/73

Manuscript Received Review Round 1 Review Round 2 Review Round 3 Accepted
2017-11-30 2017-12-09 2017-12-17 2017-12-22
Conflict of Interest Funding Ethical Approval Plagiarism X-checker Note
No Nil Yes 7%

© 2017 by Gurpreet Singh, Gurprit S Nanda, Harinder Singh and Published by Siddharth Health Research and Social Welfare Society. This is an Open Access article licensed under a Creative Commons Attribution 4.0 International License https://creativecommons.org/licenses/by/4.0/ unported [CC BY 4.0].

Introduction

Globally, 31% of deaths are due to CVDs with developing countries contributing more than three quarters of these deaths [1,2]. In 2012, 16 million deaths under 70 years out of total 17.5 million deaths were due to CVDs [1].

Rapidly rising CVD burden can be reduced in a cost-effective manner through health interventions focusing on behavioral risk factors, screening for risk factors and instituting prompt management measures among apparently healthy individuals [1,3]. These measures can prevent premature deaths, loss of Disability Adjusted Life Years (DALYs) by alleviating CVD events [4].

The rising incidence and ever growing burden of CVDs require an operational and pragmatic prevention and control strategies. Current CVD management guidelines recommend absolute risk assessment approach for promotive, preventive and curative services [2,5,6].

However, operationally, absolute risk approach algorithms require laboratory investigations which may not be readily available in resource poor regions including India [7,8]. Majority of risk factors for CVDs can be identified in periphery by auxiliary health care workers in periphery.

Studies carried out to compare non laboratory based cardiovascular disease risk assessment algorithms have found algorithms developed by World Health Organization and International Society of Hypertension (WHO/ISH) which are simple and user friendly for application [9].

Combined risk approach enables peripheral health care workers as well as clinicians to estimate likelihood of CVD events due to atherosclerosis and thus results in effective prioritization and allocation of resources [5,10,11,12]. In fact, across many developed countries, CVD risk assessment algorithms are being utilized for selection of individuals requiring more intense interventions [10].

WHO/ISH risk prediction charts were developed for use in resource poor settings to predict 10 year fatal/non- fatal CVD events. These charts were developed for different regions of the world and includes India in SEAR-D for implementation.

Further, these charts are also helpful in education of the community and can be used as a tool for

motivating individuals to leave unhealthy behaviors and adopt healthy lifestyles [11]. With ever-increasing urbanization, urban slums have emerged as a unique entity. Majority of studies have been carried out to determine CVD risk in urban and rural areas.

However, the process of sanskritization in urban slums suggests higher burden of CVD risk, which needs to be emphasized. Hence, the present study was conducted to determine cardiovascular risk profile of residents 40years and older in an urban slum using non-lab based WHO/ISH risk prediction charts and to determine the prevalence of selected risk factors for CVDs for identification of individuals at high risk and their further management.

Material and Methods

This was a cross sectional study in urban field practice area of a medical college.

Sample size: Sample size was calculated using Epi InfoTM 7. Sample size calculated for estimation of CVD risk for 99% confidence interval, with an acceptable deviation of 10%, at an expected frequency of 20% was 106 [18]. However, a total of 116 individuals were included in the study. Purposive sampling was carried out. Individuals were instructed to remain fasting a day prior to collection of data.

Inclusion and exclusion criteria: All individuals more than 40 years of age were invited for the study. Those without a prior history of cardiovascular event such as Stroke, Myocardial Infarction, Ischemic Heart Diseases, Cardiomyopathies, etc. were included in the study. Any person with a known CVD event prior to the study and those who did not gave consent were excluded.

Study instrument: Study participants were evaluated using pilot tested interview based structured questionnaire, anthropometric measurements (height, weight, waist circumference and hip circumference), measurement of blood pressure and evaluation of fasting blood glucose levels. Fluoride vacutainers were used for collection of venous blood samples for Blood sugar estimation by glucose oxidase peroxidase (GOD-POD) method. WHO/ISH cardiovascular risk prediction charts for South East Asian Region D which includes India were used to assess 10 year risk of fatal/ non-fatal cardiovascular event [12].


The variables for 10 year CVD risk prediction included gender, co-morbidity due to diabetes mellitus, smoking status, age, and blood pressure values.

Operational definitions: Administration of Questionnaire, clinical examination was carried out by resident doctors. Height was measured to nearest centimeter, using a stadiometer. Weight was measured to nearest 100 grams, using a portable weighing scale placed on cemented floor.

The individual was instructed to stand on the scale with minimal clothing, without shoes and socks, and to look straight before measuring weight. Body Mass Index (BMI) was calculated as kg/m2 and classified as underweight, normal and at increased risk for BMI values of < 18.5 kg/m2, 18.5 – 22.9 kg/ m2, and > 23 kg/m2[13,14].

Further, Brocca index was calculated to determine ideal weight as (Height in cm – 100). Any person with weight more than ideal was considered as being overweight. Waist circumference was measured using measuring tape with accuracy up to 0.1 cm at midpoint between lower border of lowest rib and upper border of iliac crest.

Increased risk of metabolic complications was considered for males and females with waist circumference of > 102 cm and > 88 cm respectively. Hip circumference was assessed across the widest portion of the buttocks. Abdominal obesity was considered in males and females for Wait-Hip Ratio (WHR) >1.0 and >0.85 respectively.

Blood pressure was measured using mercury based sphygmomanometer. A person was considered to be hypertensive when Systolic blood pressure was > 140 mm Hg ‘and/or’ diastolic blood pressure > 90 mm Hg.

Level of Physical activity was assessed on basis of activities being performed at the workplace, at home and involvement in regular physical exercises. Adequate level of physical activity was considered if the individual had vigorous activity at home ‘and/or’ strenuous work ‘and/or’ was involved in regular physical exercises. Participant was considered to be a smoker if he/she had been smoking any form of tobacco product in past one year.

An individual was considered to be diabetic if fasting venous blood sugar levels were more than 125 mg/dl. Further, individuals receiving oral hypoglycemic drugs/ insulin for treatment were considered as diabetic irrespective of their blood

sugar levels.

Statistical analysis: The data was entered into excel and was analyzed using Epi InfoTM7 and SPSS ver 21.0 software. Descriptive statistics were calculated for all variables. Chi-square test was applied to study the association of categorical variables with gender. Association was considered significant on hypothesis testing for p values < 0.05.

Results

All the study participants were more than 40 years of age without a prior CVD event. Mean age was 56.23 + 10.6 years and majority (74.1%) were females. Characteristics of study participants and association of study variables and gender is as depicted in Table 1. There was no significant gender preponderance with regard to age distribution, past history of chronic non-communicable diseases, family history of CVDs, prevalence of diabetes, high BMI and Hypertension.

However, the prevalence of smoking was higher among males as compared to females and was found to be statistically significant (p= 0.044). Females were found to have significantly higher prevalence of abdominal obesity (p = 0.001), were overweight according to Brocca index (p = 0.000) and were physically inactive (p = 0.036).

Table-1: Characteristics of Study participants

Study variable Females (%) Males (%) Total (%) P value
Total 86 (100.0) 30 (100.0) 116 (100.0) -
Age distribution
40-49 years 24 (27.9) 7 (23.3) 31 (26.7) 0.937
50-59 years 27 (31.4) 9 (30.0) 36 (31.0)
60-69 years 24 (27.9) 10 (33.3) 34 (29.3)
70 and above 11 (12.8) 4 (13.3) 15 (12.9)
Medical History
Past h/o DM 6 (7.0) 4 (13.3) 10 (8.6) 0.474*
Past h/o HTN 18 (20.9) 4 (13.3) 22 (19.0) 0.361
Family h/o CVDs 31 (36.1) 8 (26.7) 39 (33.6) 0.349
Presence of Diabetes 29 (33.7) 9 (30.0) 38 (32.8) 0.708
Smoking 6 (7.0) 6 (20.0) 12 (10.3) 0.044
Physical inactivity 66 (76.7) 17 (56.7) 83 (71.6) 0.036
Brocca index
Overweight 73 (84.9) 16 (53.3) 89 (76.7) 0.000
BMI (Asians)
Underweight 3 (3.5) 2 (6.7) 5 (4.3) -a
Normal 13 (15.1) 6 (20.0) 19 (16.4)
Obese 70 (81.4) 22 (73.3) 92 (79.3)
Waist circumference

Increased risk of metabolic complications 49(57.0) 3(10.0) 52(44.8) 0.000
WHR
Indicates abdominal fat accumulation 53 (61.6) 8 (26.7) 61 (52.6) 0.001
Blood pressure values
Normal 10 (11.6) 3 (10.0) 13 (11.2) -a
Prehypertension 27 (31.4) 10 (33.3) 37 (31.9)
Stage 1 Hypertension 26 (30.2) 11 (36.7) 37 (31.9)
Stage 2 hypertension 23 (26.7) 6 (20.0) 29 (25.0)

* Fischer exact test applied as more than 20% of expected cell count <5

a Chi square for trend not applied as it did not meet Cochran’s criteria.

Table-2: Prevalence of selected NCD risk factors among CVD risk groups

NCD risk factor Cardiovascular risk. % (95% CI) Total % (95% CI)
Low risk (<10%) Moderate risk (10% to <30%) High risk (> 30%)
Total (n, %) 53 (45.7) 32 (27.6) 31 (26.7) 116 (100)
Hypertension 18.9 (9.4 – 31.9) 78.1 (60.0 – 90.7) 100.0 56.9 (47.4 – 66.1)
Diabetes 22.6 (12.3 – 36.2) 21.9 (9.3 – 39.9) 61.3 (42.2 – 78.2) 32.7 (24.3 – 42.1)
Physical inactivity 73.6 (59.7 – 84.7) 62.5 (43.7 – 78.9) 77.4 (58.9 – 90.4) 71.6 (62.4 – 79.5 )
Abdominal obesity 45.3 (31.6 – 59.6) 56.3 (37.7 – 73.6) 61.3 (42.2 – 78.2 ) 52.6 (43.1 – 61.9)
Overweight 75.5 (61.7 – 86.2) 68.8 (49.9 – 83.9) 87.1 (70.2 – 96.4) 76.7 (67.9 – 84.1)
BMI > 23 kg/m2 83.0 (70.2 -91.9) 71.8 (53.3 -86.3) 80.7 (62.5 – 92.6) 79.3 (70.8 – 86.3)
Smoking 9.4 (3.1 – 20.7) 9.4 (1.9 – 25.0) 12.9 (3.6 – 29.8) 10.3 (5.5 – 17.4)
Family h/o CVDs 33.9 (21.5 – 48.3) 25.0 (11.5 – 43.4) 41.9 (24.6 – 60.9) 33.7 (25.1 – 42.9)

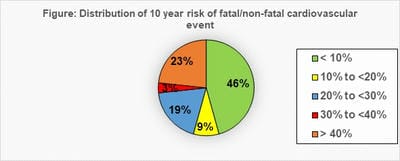
Distribution of 10 year risk of CVD event, according to WHO/ISH CVD risk charts for SEAR D region is presented in Fig 1. Majority (46%) of the study population had 10 year CVD event risk of less than 10%. Very high 10 year CVD event risk (>40%) was seen in 23% of the study population.

Only 04 (3%) participants had 10 year CVD risk between 30 to 39%. Thus, any person with 10-year CVD risk more than 30% was considered to be at high risk of CVD event and were considered as potential candidates requiring immediate intervention and treatment.

Fig-1: Distribution of 10 year risk of fatal/non-fatal cardiovascular event using WHO/ISH Risk prediction charts for SEAR- D Region

public_73_01.jpg

Table 2 represents distribution of selected NCD risk factors according to CVD risk groups. As shown in table, higher prevalence of Hypertension and Diabetes, abdominal obesity, overweight, and smoking was found in individuals at high risk of CVD event as compared to those on low risk. However, similar percentage of individuals with BMI >23 kg/m2 and physical inactivity were present in risk groups.

Discussion

WHO recommends that medical intervention on basis of CVD risk stratification using risk prediction charts should be applied in countries where resources are constrained [12]. The present study was conducted in an urban slum to identify individuals at high risk of CVD events and thus to ensure that medical interventions are provided using combined risk approach to those in need and in proportion to the need.

Individuals who were detected to have high risk of CVD or its risk factors in the study were referred to hospital for further management. In the present study, mean age was 56.23 years and majority (74.1%) were females. This was similar to a study carried in rural settings in southern part of the country where mean age was 54.2 years and 53.3% were females [11].

However, in a study among Group C employees in Puducherry, mean age was 40.9 years and majority (81.3%) were males [15]. Socio-demographic assessment of population in studies determining CVD risk is essential in studies determining CVD risk for interpretation of results as well as to determine generalizability.

In the present study, abdominal obesity, smoking status, overweight and physical inactivity was found to be significantly different among males and females.


In a study carried out in Northern India, physical inactivity was found to be higher among females and other CVD risk factors were more prevalent among males [16].

A study in Tamil Nadu found prevalence of overweight and obesity to be higher in females [17].Further, studies have also found independent association of age, gender, obesity, physical inactivity and family history with cardiovascular diseases [15].

Globally, 10-year CVD risk has been found to be variable among populations. In the present study, 23% participants were found to have 10 year CVD risk > 40%. This was relatively higher as compared to another carried out in Group C employees in Puducherry where only  4% individuals with CVD risk >10% [15].

Another community based cross sectional study in Puducherry found 17% participants with CVD risk >30% [18]. Internationally, a study carried out in three Asian countries found high CVD risk in 6%, 2.3% and 1.3% study participants in Mongolia, Malaysia and Cambodia respectively [19]. Another study carried out in a selected community in Nepal found ≥10% CVD risk in 14.6% respondents [20].

At a single Latin American center, study found 14.7% having CVD risk >20% [21]. This variation has been attributed to varied age and gender composition of the study subjects as well as their socioeconomic status and lifestyle. Studies have found higher prevalence of CVD risk factors among individuals in lower socioeconomic status residing in urban slums [16,22,23].

In the present study, Obesity and physical inactivity was found to be similar among CVD risk groups whereas hypertension, diabetes, abdominal obesity and smoking was higher among individuals with high CVD risk. These findings support the fact that determining the need for medical intervention on basis of a single risk factor may not be appropriate and combination of risk factors should be utilized.

Atherosclerosis resulting in CVD events has also been documented to be rarely due to single risk factor but mostly due to combination of risk factors. Thus, a combined risk approach is required to manage rapidly growing burden of CVDs at a cost individuals as well as health care systems can afford [6].

Limitations of the study

Estimation of CVD risk may be underestimated when large proportion of individuals are availing treatment or have an underlying pathology which can affect cardio vascular outcomes. On the other side, overestimation of CVD risk may result when single visit measurements are carried out [19].

However, despite the inherent limitations of WHO/ISH CVD risk prediction charts, it has been shown to be effective in identification of individuals at high risk, to determine requirement of further investigations and management in a cost-effective manner, and in averting CVD events in resource constraint settings [2,24].

Conclusion

High level of CVD risk in the present study emphasizes need for large-scale studies and comprehensive strategies in urban slums to curtail the rapidly growing dual burden of diseases. The need for medical interventions on basis of a single risk factor may not be appropriate and combination of risk factors should be utilized. Incidence of CVD events can be alleviated with early identification of apparently healthy individuals using WHO/ISH risk prediction charts.

Contribution by authors

  Contributor 1 Contributor 2 Contributor 3
Concepts Y Y Y
Design Y Y Y
Definition of intellectual content Y Y Y
Literature search Y Y -
Data acquisition Y Y Y
Data analysis Y - Y
Statistical analysis Y Y -
Manuscript preparation Y Y Y
Manuscript editing Y Y Y
Manuscript review Y Y Y
Guarantor Y Y Y

What this study add to existing knowledge?

With ever-increasing urbanization, urban slums have emerged as a unique entity. Majority of studies have been carried out to determine CVD risk in urban and rural areas.


The present study brings forward the extent of cardiovascular risk factors in urban slums. In the present study, higher prevalence of Hypertension and Diabetes, abdominal obesity, overweight, and smoking was found in individuals at high risk of CVD event as compared to those at low risk. Further, 23% participants were found to have 10 year CVD risk > 40%. This was relatively higher as compared to previous studies carried in urban and rural areas.

Thus, the present study brings forward two important aspects in prevention of cardiovascular diseases. Firstly, determining the need for medical intervention on basis of a single risk factor may not be appropriate and combination of risk factors should be utilized. Secondly, there is likely to be higher burden of cardiovascular diseases in urban slums. Large multicentric studies should be undertaken to estimate true burden and to make evidence based prevention and control programmes in urban slums.

Reference

  1. WHO. Cardiovascular diseases (CVDs)- Fact sheet N 317. World Health Organization. Updated January 2015.
  2. Mendis S, Lindholm LH, Anderson SG, Alwan A, Koju R, Onwubere BJ, et al. Total cardiovascular risk approach to improve efficiency of cardiovascular prevention in resource constrain settings. J Clin Epidemiol. 2011;64(12)1451-62.
  3. Ferket BS, Colkesen EB, Visser JJ, Spronk S, Kraaijenhagen RA, Steyerberg EW, Hunink MG. Systematic review of guidelines on cardiovascular risk assessment- Which recommendations should clinicians follow for a cardiovascular health check?. Arch Intern Med. 2010;11;170(1)27-40.
  4. WHO. Cardiovascular diseases. World Health Organization.
  5. WHO. Prevention of Cardiovascular Disease- Guidelines for Assessment and Management of Cardiovascular risk. Geneva- World Health Organization, WHO Press. 2007.
  1. Cooney MT, Dudina A, D'Agostino R, Graham IM. Cardiovascular risk-estimation systems in primary prevention do they differ?- Do they make a difference? Can we see the future?. Circulation. 2010;122(3):300-10.
  2. Gaziano TA, Young CR, Fitzmaurice G, Atwood S, Gaziano JM. Laboratory-based versus non-laboratory-based method for assessment of cardiovascular disease risk- the NHANES I Follow-up Study cohort. Lancet. 2008;15;371(9616)923-31.
  3. Beswick AD, Brindle P, Fahey T, Ebrahim S. A Systematic Review of Risk Scoring Methods and Clinical Decision Aids Used in the Primary Prevention of Coronary Heart Disease (Supplement). London- Royal College of General Practitioners (UK). 2008 May.
  4. Kariuki JK, Stuart-Shor EM, Leveille SG, Hayman LL. Evaluation of the performance of existing non-laboratory based cardiovascular risk assessment algorithms. BMC Cardiovasc Disord. 2013;13(1)1.
  5. Lloyd-Jones DM. Cardiovascular risk prediction basic concepts, current status, and future directions. Circulation. 2010;121(15)1768-77.
  6. Shrivastava SR, Ghorpade AG, Shrivastava PS. A Community-based Cross-sectional Study of Cardiovascular Risk in a Rural Community of Puducherry. Heart Views. 2015;16(4)131-6.
  7. WHO, UNAIDS. Prevention of cardiovascular disease. World Health Organization. 2007.
  8. Goh LG, Dhaliwal SS, Welborn TA, Lee AH, Della PR. Anthropometric measurements of general and central obesity and the prediction of cardiovascular disease risk in women- a cross-sectional study. BMJ open. 2014;4(2)e004138.
  9. WHO Expert Consultation. Appropriate body-mass index for Asian populations and its implications for policy and intervention strategies. Lancet. 2004;10;363(9403)157-63.

  1. Aswin K, Ghorpade AG, Kar SS, Kumar G. Cardiovascular disease risk factor profiling of group C employees in Jipmer, Puducherry. Journal of family medicine and primary care. 2014;3(3)255.
  2. Kar SS, Thakur JS, Virdi NK, Jain S, Kumar R. Risk factors for cardiovascular diseases- is the social gradient reversing in northern India?. Natl Med J India. 2010;23(4)206-9.
  3. Samuel P, Antonisamy B, Raghupathy P, Richard J, Fall CH. Socio-economic status and cardiovascular risk factors in rural and urban areas of Vellore, Tamilnadu, South India. Int J Epidemiol. 2012;41(5)1315-27.
  4. Shrivastava SR, Ghorpade AG, Shrivastava PS. A community-based cross-sectional study of cardiovascular risk in a rural community of Puducherry. Heart Views. 2015;16(4)131.
  5. Otgontuya D, Oum S, Buckley BS, Bonita R. Assessment of total cardiovascular risk using WHO/ISH risk prediction charts in three low and middle income countries in Asia. BMC Public Health. 2013;5;13;539.
  1. Dhungana R, Khanal M, Pandey A, Thapa P, Devkota S, Mumu S, et al. Assessment of Short Term Cardiovascular Risk Among 40 Years and Above Population in a Selected Community of Kathmandu, Nepal. Journal of Nepal Health Research Council. 2015.
  2. Piskorz D, Bongarzoni L, Citta L, Citta N, Citta P, Keller L, et al. World Health Organization cardiovascular risk stratification and target organ damage. Hipertension y riesgo vascular. 2015.
  3. Gupta R, Gupta V, Sarna M, Prakash H, Rastogi S, Gupta K. Serial epidemiological surveys in an urban Indian population demonstrate increasing coronary risk factors among the lower socioeconomic strata. Journal-Association of physicians of India. 2003;51;470-8.
  4. Misra A, Pandey RM, Devi JR, Sharma R, Vikram NK, Khanna N. High prevalence of diabetes, obesity and dyslipidaemia in urban slum population in northern India. Int J Obes Relat Metab Disord. 2001;25(11)1722-9.
  5. Ndindjock R, Gedeon J, Mendis S, Paccaud F, Bovet P. Potential impact of single-risk-factor versus total risk management for the prevention of cardiovascular events in Seychelles. Bull World Health Organ. 2011;89(4)286-95.