E-ISSN:2349-4166
P-ISSN:2349-4158

Research Article

Population

Public Health Review - International Journal of Public Health Research

2020 Volume 7 Number 6 November-December
Publisherwww.medresearch.in

Impacts on dietary habits and health of Indian population during COVID-19 lockdown

Rajesh Kumar R.1, Arumugham Dhanaraj S.2*, Saini R.3, Kumari P.4, Roy P.5, Paul S.6
DOI: https://doi.org/10.17511/ijphr.2020.i06.01

1 Ramasamy Rajesh Kumar, Research Scientist, College of Agriculture and Biotechnology, Zhejiang University, Hangzhou, China.

2* Saravanakumari Arumugham Dhanaraj, Assistant Professor, Department of Community Medicine, Government Villupuram Medical College, Villupuram, Tamilnadu, India.

3 Rashmi Saini, UG Student, Department of Home Science, Lady Irwin College, Delhi University, New Delhi, India.

4 Punita Kumari, Research Scholar, School of Material Science and Engineering, Wuhan University of Technology, Wuhan, China.

5 Priyanka Roy, Research Scholar, National Institute of Food Technology Entrepreneurship and Management, Sonepat, Haryana, India.

6 Sayan Paul, Research Scholar, Department of Biotechnology, Manonmaniam Sundaranar University, Tirunelveli, Tamilnadu, India.

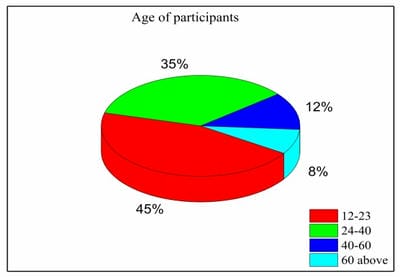
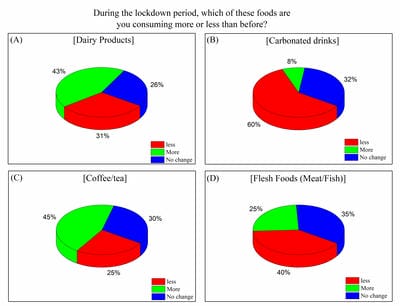
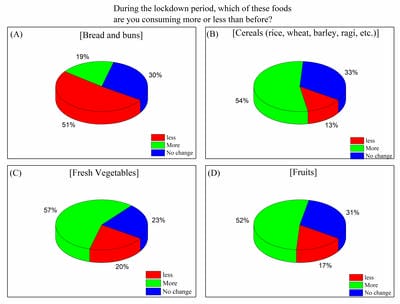
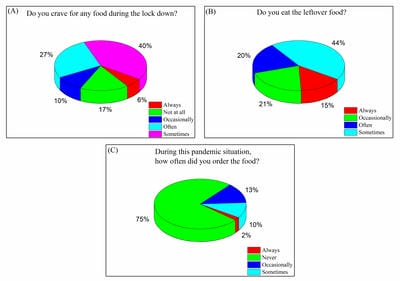
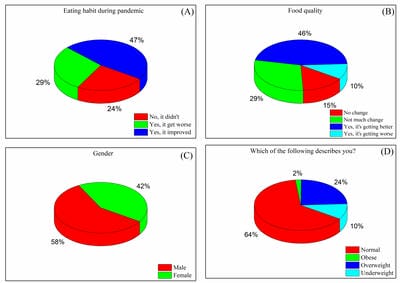
In late 2019 the outbreak of a novel infectious coronavirus (SARS CoV2) which became global pandemic and named as Coronavirus disease (CoViD-19) World Health Organization (WHO). On 22 March, 2020 the Prime Minister of India announced and 14 hours’ public curfew and from 24 March, 2020 announced sudden complete lockdown. The sudden complete lockdown made changes in the living habits and social behaviors of public. Web based survey was conducted among the Indian population of different age groups to understand the impacts on dietary habits and health during the sudden complete lockdown in India.

Keywords: Dietary habits, Health, India, COVID19, Pandemic, Lockdown

Corresponding Author How to Cite this Article To Browse
Saravanakumari Arumugham Dhanaraj, Assistant Professor, Department of Community Medicine, Government Villupuram Medical College,Villupuram, Tamilnadu, India
Email: dr.saravanakumari@gmail.com
Kumar RR, Dhanaraj SA, Saini R, Kumari P, Roy P, Paul S. Impacts on dietary habits and health of Indian population during COVID-19 lockdown. Public Health Rev Int J Public Health Res. 2020;7(6):38-50.
Available From
https://publichealth.medresearch.in/index.php/ijphr/article/view/143

Manuscript Received Review Round 1 Review Round 2 Review Round 3 Accepted
2020-11-01 2020-11-10 2020-11-19 2020-12-25
Conflict of Interest Funding Ethical Approval Plagiarism X-checker Note
No Nil Yes 5%

© 2020 by Ramasamy Rajesh Kumar, Saravanakumari Arumugham Dhanaraj, Rashmi Saini, Punita Kumari, Priyanka Roy, Sayan Paul and Published by Siddharth Health Research and Social Welfare Society. This is an Open Access article licensed under a Creative Commons Attribution 4.0 International License https://creativecommons.org/licenses/by/4.0/ unported [CC BY 4.0].

Introduction

Good diet is an important part of leading a healthy lifestyle. Combined with physical activity, diet can help to reach and maintain a healthy weight and promote your overall health. CoViD-19, is a severe acute respiratory syndrome caused by SARS coronavirus 2 (SARS-CoV-2). In December 2019 from Huanan seafood market Wuhan City of Hubei, Province of China SARS-CoV-2 transit from animals to humans, and spread to the rest of the world [1 ]. On the 30 January 2020, due to the growing infection rates at Chinese and international locations the WHO Emergency Committee declared a global health emergency [2].

In India, in the state of Kerala on 30 January 2020 the first confirmed COVID-19 case was reported (WHO 2020a) and 22 new cases were recognized on 4 March 2020 due to spread to the other parts of the country. On 12 March 2020, the COVID-19 first death was reported in India (WHO 2020a). On 22 March 2020, prime minister of India announced 14 hours’ public curfew. To handle the worsening of pandemic in country on 24 March 2020, the prime minister suddenly ordered a complete nationwide lockdown for 21 days (https://www.mha.gov.in/). During the sudden lockdown in India, all places of public gatherings such as schools, cinemas, restaurants, shopping complexes, higher educational institutions were closed. To avoid crowds and control the spread of CoViD19 employees and students were being asked to work from home. All types of transportation services, including rail, road and air, were suspended with exceptions for essential services were closed.

In particular, after almost 4 months of lockdown, India is the third world’s worst-affected country in the CoViD-19 pandemic [4]. Due to sudden lockdown various changes has occurred in the habits and lifestyles of the public, with a complete reduction of any form of socialization. Physical distancing and self-isolation strongly impacted people lives, affecting in particular eating habits and everyday behaviors.

Further, the disturbance of the routine work caused by the lockdown could result in monotonous life style that leads to consumption of higher calories [6]. Moreover watching television and reading social media news of adverse situation due to lockdown leading increases stress and consecutively increases overeating of readily available food that rich in sugar such as chocolates and biscuits [7,8].

These ready to eat food are rich in carbohydrates, thus tiger enhance happy hormone serotonin production [9]. Thus higher consumption of rich in sugar and fat foods associated with the health complication like hypertension and cardiovascular diseases, obesity, diabetes which leading to risk factor in COVID-19 completion [10,11].

The limited access to daily groceries may lead to reduce the consumption of fresh foods, especially fruit, vegetables and meat or fish, only the highly processed food available such as, junk foods, snacks, and ready-to-eat cereals, which tend to be high in fats, sugars, and salt. This crisis leading to change emotional responses of individual that a negative effect in human psychology [12,13], the availability also changes human food habit leading to stress eating or “emotional eating” [14,15]. Quarantine and self isolation even changes people satiety and hunger, hence leading overeating [16,17].

In order to prevent the transmission of virus and maintained all containment measures this “Lockdown” was introduces. But this lockdown led to crisis of work and resources. This crisis was adversely affecting sedentary behaviors of individual; it does modify in smoking and sleeping habits. Sleep disturbances and food habit changes the circadian rhythm in most of us [19,20]. In a study it was proven that good Mediterranean diet (MD) and good sleep lower body mass index (BMI) in middle-aged adults [21].

In addition smoking have a significant association with SARS-CoV-2 infection, unlike air pollution, and thus smokers shows severe COVID-19 symptoms [22]. Eating habits and lifestyle modification effect our health and taking correct nutrition not at only choice but depends on finical status is crucial, in one side migrant labour and worker can’t afford good food. But in the same tine booting immune system is time in need. The Ministry of AYUSH gives guideline to boot immunity by incorporation of specific vegetables, herbs and spices in daily diet [23]. As the overweight people and obese people are in high risk if infected with COVID-19 and can develop secondary complication [24]. The produces cytokines and proinflammatory milieu observed in adipose tissue, of obsess people which one of the risk factor in viral infection [25]. Moreover, patients with high abdominal fat have constricted pulmonary physiology thus facing more difficult ventilation thus increase complication after respiratory viral infection [26].


Methodology

Objective of the Survey: This survey research study aimed to assess the impact of lockdown on individuals’ daily habits such as sleep/got up, social media use, work from home and more selected variables. It was also intended to measure the adjustment made by people about the crisis and how they are maintaining their daily routine.

Study Method: Questionnaire (Online)

Sampling technique: Probability sampling-Simple random sampling

Sample Size: 100 Study population

Ethical Permission: Informed all participants about the survey study to be used for publishing

Study tool: A self-prepared semi structured anonymous questionnaire was used to record the responses of participants. The questionnaire was prepared after the literature review, focus group discussion and current news information in consultation with experts from different fields to check relevance and make necessary changes according to our study requirements

Result and discussion

public_143_01.jpg

Figure 1: Age of the Participants

Total 100 People from 4 different age group were participated this online questionnaire and submitted their response.


public_143_02.jpg

Figure 2: (A) Overall Health (B) Physical heath (C) Life quality (D) Mental Health participants before and during pandemic


Participants have presented their response in order to compare their overall health before and during pandemics. Few participants (2) said that their overall health downgrades due to pandemics, while most of participants (24) agreed their physical health became poor rather than good or fair.

The life quality of the participants (3) also decreased and became poor while 4 participants faced very poor mental health during pandemic.

public_143_03.jpg

Figure 3: (A) Sleeping (B) Smoking Response of participants before and during pandemic

The sleeping of the participants also disturbed during pandemic.

People were sleeping very less before but during pandemic participants observed they are


public_143_04.jpg


Figure 4: (A) Changes in weight (B) Sense of hunger and satiety (C) Physical activity (D) Alcohol consumption (E) Water drinking (F) Meal/ Snacks skipping response during pandemic

Participants monitored their weight during pandemic and 11% said they had put weight while 26% participants agreed to put so much weight. Weight gaining issue during pandemic was observed by several people.

Whereas 34% participants had reported less appetite during pandemic. 22 % participants described rarely physical activity during pandemic that includes walking, running or yoga. 4 % participants notify their alcohol consumption been raised during pandemic. 10% participants said they are during less than 1 liter every day. While 37% participants said their skipping breakfast behavior during pandemic.


public_143_05.jpg

Figure 5: (A) Dairy Products (B) Carbonated Drinks (C) Tea/ coffee (D) Meat/ fish consumption response during pandemics

public_143_06.jpg


Figure 6: Meal/ Vegetable / Fruits consumption response during pandemics

Figure 6, explained the daily food such as breads, carbs, vegetables and fruits consumptions by the participants during pandemic.


public_143_07.jpg

Figure 7: Craving, Leftover food, Food order consumption response during pandemics

The participants craving, leftover food eating and food ordering percentage is illustrated in figure 6. 27 % participants reported they often crave for food, while 20 % participants said they use to eat leftover food during pandemic.

public_143_08.jpg

Figure 8: (A) Eating habit (B) Food quality (C) Gender (D) weight of the participants during pandemic recorded


Among 100 participants 58% females and 42% males taken part. 10% and 24% participants reported that they are facing under or over weight problem respectively.

Whereas, 10% participants observed food quality is getting worse. 29% participants denoted that their food quality has reached worst level during pandemic.


public_143_09.jpg

Figure 9: Food consumption response during pandemics

Food use in everyday life by participants during pandemic is listed in figure 9.

Table 1: Participants from Different state

State No. of Participants
Andhra Pradesh 2
Bihar 3
Delhi 32
Haryana 4
Himachal Pradesh 2
Jharkhand 2

Madhya Pradesh 9
Maharashtra 2
Tamil Nadu 22
Telangana 5
Uttar Pradesh 14
Uttrakhand 2
WestBengal 1
Total 100

Table 2: Participants from Different Occupation

Occupation No. of Participants
Assistance Professor 19
Banker 1
Business Profession 1
Consultant 1
Engineer 1
Entrepreneur 2
Farmer 1
Media Person 1
Medical Profession 1
Microbiologist 1
Nursing Profession 1
Nutritionist 1
Professor 5
Research Associate 2
Research Scholar 7
School Teacher 1
Student 52
Technologist 1
Yoga Teacher 2
Total 100

Table-3: Symptoms experienced by the participants during COVID-19 pandemic.

Symptoms No. of Participants
Anxiety 13
Anxiety & thoughts of suicide 1
Anxiety, I have not experienced 2
Anxiety, Persistent sadness 4
Anxiety, Persistent sadness, Heavy Drinking 1
Binge eating 1
Not experienced any symptoms 43
Not Sleeping well 21
Not Sleeping well, Anxiety, Persistent sadness 3
Not Sleeping well, Drug Use 1
Not Sleeping well, Thoughts Self-harm 3
Not Sleeping well, Smoking at home, Self-harm 2
Persistent sadness 3
Smoking at home 1
Total 100

Table 4: Mealtime and snacking patterns changed observed in participants since lockdown began

Changed Observed No. of Participants
I eat less during main meal 12
I eat less during main meals; I eat less snacks 1
My mealtimes have changed 25
I eat less during main meals; I eat more snacks 2
I eat less during main meals, my mealtimes changed 2
I eat less snacks 5
I eat less snacks, my mealtimes have changed 4
I eat more during main meals 18
I eat more during main meals; I eat more snacks 4
I eat more during main meals, my mealtimes changed 5
I eat more snacks 4
My mealtime and snacking patterns not changed 18
Total 100

Table 5: Craving for food observed by the participants

Food Craving No. of Participants
Bread and Bun, pizza 1
Chocolates 8
Chocolates, Spicy food items 3
Food from native place 1
Fried foods 5
Fried foods, Chocolates 2
Fried foods, Spicy food items 2
Lemon rice 1
Non-veg 25
Non-veg, Chocolates, Spicy food items 3
Non-veg, Spicy food items 5
Nothing 2
Oats 1
Spicy food items 17
Spicy food items, Street food 1
Sweets, Cheesy food items 2
Sweets, Chocolates 1
Sweets, Chocolates, Spicy food items 6
Sweets, Non-veg, Fried foods 1
Sweets, Non-veg, Chocolates, Spicy food items 2
Sweets, Spicy food items 2
Vegetable 2
Total 100

Table 6: Type of Physical activity performed by participants during lockdown

Physical Activities No. of Participants
Aerobics 3
Cycling 1
Dancing, Yoga 5

Doing home cleaning works daily 1
Do not perform any regular physical activity 25
Push-ups, Dancing 1
Reading 1
Running/jogging 2
Running/jogging, Cycling, Dancing 1
Running/jogging, Cycling, Push-ups, Skipping 5
Skipping 1
Sleeping 4
Walking 23
Walking, Aerobics 1
Walking, Aerobics, Skipping, Dancing 1
Walking, Cycling 3
Walking, Cycling, Push-ups 1
Walking, Daily walking at evening 1
Walking, Dancing 3
Walking, Push-ups 6
Walking, Running/jogging 3
Walking, Jogging, Skipping, Dancing 1
Walking, Skipping 3
Walking, Yoga 4
Total 100

Table-7: Changed way of food preparation at home by the participants during the lockdown. 

Way of Eating No. Of Participants
Prepares food at home on the same way 47
Prepares food at homeless 6
Prepares food at home more 47
Total 100

Statistical analyses

Data are represented as number and percentage in parentheses (%) for categorical variables, or median and interquartile range in square brackets [IQR] for continuous variables. Te Shapiro–Wilk test was performed in order to evaluate variables distribution. All the variables had skewed distribution. Te Spearman correlation coeffcient was calculated in order to evaluate the correlation between continuous variables. Chi square test was employed to assess the association between categorical variables while McNeman analysis was used to investigate the diference between categorical variables pre and during the COVID-19 emergency.

Discussion

Participants: After collecting all the response and data from the online-survey were concluded and analyzed.

A total of 100 participants from 16 different state of India completed the online-questionnaire, and data, there are 100 respondents have been included in the study. The participants aged are between 12 years and 60 above years. State coverage spreads all over the India including metropolitan cities. The highest numbers of participants are from capital of India as 25% participants are from Delhi, followed by 22% participants from Tamil Nadu, then 10% participants from Uttar Pradesh and 1 to below 10% participants from other State.

The participants included in the study are of different profession; about 45-50% of participants are students and other are of different profession like banker, assistant professor, medical professional, engineer, farmer etc. According to the age of the participants there are four major divisions that includes in Fig.1, the highest number of participants that is about 45% are of age group 12-23 years, followed by 35% of participants are in the age group of 24-40years old, then 12% of participants are of age 40-60years and the least participants around 8% are of age 60 above. The least percentage of participants are from senior citizen might be because the questioner was online and old aged people are not much good in using smart phone or access to internet. This study includes 58% male participants and 42% female participants in Fig. 8 (C) who had filled the online questioner.

Health before and during Lockdown

In this preliminary study the participant’s health and quality of life are analyzed in Fig.2. When overall health was consider it was observed that most of the participants around 30% and 37%, were excellent and good overall health before the lockdown respectively, but only few only 2% of participant says that their overall health become poor during lockdown.

The physical health of most of the participants around 36% was good before the lockdown. However, around 18% participant physical health become poor during lockdown this is might be because most of the outdoor activities are restricted and gym and other outdoor sports are off during the lockdown.

It was very interesting to observe that the quality of life of the 37% participants become good during the lockdown. However, those 35 participants have very good quality of life before the lockdown have reduced to 21 participants.


In average 32 participants mental health was very good before lockdown, however 32 participants also have good mental health during the lockdown. In overall study of mental health of the participants seems to be become poor during the lockdown this is may be due to monotonous lifestyle.

Sleeping Habits

The sleeping time (Fig.3-A) of 70% participants was average of 5-8hrs before lockdown. But during lockdown 31% participant sleeping hours increase more than 8hrs. This may be because most of the participant in this study population are teacher and students, due to lockdown office and education institute are closed thus due to less workload people get more time to sleep.

Smoking Habits

It was observed that the smoking habit in this study population is very less on most of them are non-smoker. The pandemic situation makes people more health aware and smoker become non-smoker during this lockdown (Fig. 3-B) and around 90% are become non-smoker during lockdown.

Overall Lifestyle Study: Food Habit, Body Weight, Physical Activities

In Fig. 4 (A) the weight gain of the participants were studies. It was observed that 33% participant loss weight during the lockdown, 30% participant does not lose or gain weight, only 11% participant gain weight. It might be because the people eat homemade healthy food thus most of them either loss weight or weight remain same.

In the study of Sense of hunger and satiety in Fig. 4 (B), 46% participant observed no change, 30% participant observed less appetite. This might be because the food and meal were taken in time thus they do not observe any change. Only 20% observed more appetite, might be those people stay outside and due to lockdown came to home and thus homemade food be more delicious to them. In the study of physical activities during the lockdown in Fig. 4(C), it was observed a discrete distribution of date where 28% participant do physical activities everyday and the same 28% of participant do physical activities few times in a week. In contrast 22% of participants rarely or never do physical activities. However, 12% and 10% do physical activities few times or once in a week respectively. This discrete data was observed may be because the age group of the participant are variety in nature.

The study of alcohol consumption in a week in Fig. 4 (D), it was observed that 52% of participant’s lockdown does not have any effect and their alcohol intake do not change. This might be because most of the participants are students; they are not in the habit of alcohol consumption. However, 44% participant’s alcohol consumption decreases this is might be because of non availability. Only 4% showed increase in alcohol consumption this might be due to stress.

Water drinking study during pandemic in Fig.4 (E), it was observed that most of the participants 47% drink more than 3liters of water in a day, in average 1-2liters of water drink by 43% participants and only 10% of participants drink less then 1liter of water.

The study of skipping meal in Fig.4 (F), it was observed that most of the people (34%) during lockdown skip breakfast, where as 37% people does not skip any meal, 20% skip snacks this might be because homemade lunch and dinner is sufficient for fulfill the hunger. Only 6% and 3% people skip lunch and dinner respectively.

Beverage and Non-vegetarian food consume during Lockdown (Dairy, Carbonated drink, Tea/Coffee and Fish/Meat)

The participant’s food choice for dairy products was study in Fig. 5 (A), it was observed 43% people used dairy product more during lockdown, this might be it was easy available for them. However, 31% people dairy product consumption reduces, on the other hand 26% people dairy product consumption remain as it is. Dairy is one of the essential commodity thus during lockdown the supply of such product still available.

The study on the intake of carbonated drink in Fig. 5 (B), as the available was less thus it was observed that 60% people consume less carbonated drink. Only 8% people carbonated drink consumption increases, where as 32% people observe no change.

The study on the consumption of tea and coffee in Fig. 5 (C), it was observed that 45% people show increase in consumption, 30% show no change and 25% consumption become less.

The study on non-vegetarian food preference of the consumer in Fig.5 (D), due to less availability of fresh fish/meat the consumption of 40% people is reduces, 35% observed no changes and 25% fish/meat consumption increases.


Cereals/grain and Fresh fruit/vegetables consumption during lockdown

The study on the bakery food item such as bread/buns in Fig. 6 (A), as the available was less thus it was observed that 51% people consumption decreases, 30% show no changes where as 18% participants consumption increases.

The study on the Cereals food item such as rice, wheat, barley etc. in Fig. 6 (B), as the available was more and people have stock in their home thus 54% the consumption increases. Whereas, 30% observed no changes and only 13% consumption reduces. The study on the fresh vegetables in Fig. 6 (C), 57% participant’s consumption increases, 20% consumption decreases, where as 23% observed no change. Similar response observed in the study of fruit intake in Fig. 6 (D), 52% participant’s consumption increases, 17% consumption decreases, where as 31% observed no change.

Craving, Leftover food, Food order consumption response during pandemics

The participant’s food craving was studied in Fig. 7 (A), it was observed 40% people feel craving for food sometimes, 27% feel often and 10% feel occasionally. However, 17% people not at all feel any craving for food and 6% always feel craving for food. Although craving for food when the availability is less is quite common, but in this crisis fulfilling the cravenness is a challenge for many. The study on the Leftover food eating habit in Fig. 7 (B), 44% participants in the habit of eating leftover food sometimes, 21% and 20% eat leftover food occasionally and often respectively. Whereas, 15% participant always in the habit of eating leftover food.

Food order consumption response during pandemics was studied in Fig. 7 (C), as all the food order services was restricted due to lockdown thus 75% participants never order food from outside, 13% and 10% order food from outside occasionally and sometimes respectively. Whereas, only 2% participant always in the habit of ordering food from outside, might be because there are no other option available for them.

Eating habit, Food quality, Weight of the participants during pandemic recorded

The eating habit of the participants was studied in Fig. 8 (A); it was observed 47% eating habit improves during lockdown, 29% says that their eating habit become worse.

However, 24% does not observe any improvement in eating habit.

Food quality choice for the participants was studied in Fig. 8 (B); it was observed 46% participants started eating better quality food during lockdown, 29% observed not much changes and 15% observed no change. Whereas 10% of participants observed that their food quality becomes worse.

The body weight of the participants during pandemic recorded in Fig. 8 (D), 64% participants body weight remains normal during lockdown, thus lockdown does not have any effect on their body weight. 24% people becomes overweight might be because of stress eating. Whereas, 10% people become underweight might be because of less availability of their desirable food, and only 2% become obese during lockdown.

Food Dishes consumption rate during pandemics

The sugar consumption by the participants during lockdown was studied in Fig. 9 (A); it was observed that 60% people use less sugar during lockdown this is because to maintain fitness. 26% observed no change, where as only 14% might be in stress thus has eaten more sugar. Similar data was observed in sweet consumption in Fig. 9 (B); as sweet shop were closed thus 57% eat less sweet during lockdown, 23% observed no change, where as only 20% might they get availability of sweet nearby.

Similarly, the consumption of seasonal sauces in Fig. 9 (C); was observed here 58% people consumption become less, 31% observed no change and only 11% consumption of seasonal sauces increases.

As refer to the previous data of Fig.4 (F) snacks was skipped by 20% people, hence relevant result observed in Fig.9 (D), as 50% participant snacks consumption become less, 24% observed no change where as 26% it’s consumption increases, this might because easy availability.

Legume consumption among the participant has equal distribution observed in Fig.9 (E), for 35% participants consumption decreases, 34% observed no changes and 31% it increases. The rate of consumption of bakery food item such as bread/buns in Fig. 9 (F) has similar response as in previous study in Fig. 6 (A), for 65% participant consumption reduces due to non availability. 26% observed no changes and 9% it increases.


The study pastries made by the participants in Fig. 9 (G). It was observed 57% make less homemade pastries, 39% observed no changes and 4% it increases. This might be because less availability of ingredient. Similar response observed in homemade piazza Fig. 9 (H); it was observed 55% less consumption of homemade piazza, 38% observed no changes and only 7% it increases.

Conclusion

Total 100 people from 16 different states has taken participated given the answer from 31 different questions and shared their pandemics experience regarding diet and health issue. The overall health was categorized into physical and mental health in that participants share their response based upon before and during pandemic situation. It was noticed that participated life quality and mental health response was not so good during pandemics, where as participants order less food from outside and almost stop going out. This condition leads to develop mental health issue to few participant and they didn't feel good about it.

In few cases the sleeping nature also observed disturbed, while few participants getting anxiety and stress during pandemic. Few participates crave for non vegetarian food item more since it was not easily available. Few participants observe their eating habit changed and not feeling to eating as usual, while most of people still skipping their food routine. These patterns indicated that the diet of many participants has changed or disturb due to pandemics that affects their overall heath including mental health. One good thing was notice participant having food with the family and eating homemade food during pandemics.

What does this study adds to existing knowledge ?

The existing knowledge includes the study done in Italy on the lifestyle of European people. But the present study is done Indian people, that highlight the uncertain lockdown affect on Indian people lifestyle. The food habit and food preparing pattern of Asian people is quite different then European people. In India the COVID scenario is far more different than other countries as reporting a first COVID19 case Govt. certainly announce complete lockdown that leads a huge problem for daily worker. As a result, lots of people lost job and consequently leading an economic and mental crisis.

Author’s contribution

Dr. Ramasamy Rajesh Kumar – Designed the work plan and collected the data

Dr. Saravanakumari Arumugham Dhanaraj – Designed the work plan

Ms. Rashmi Saini and Dr. Punita Kumari – Prepared the Graphs and Tables

Ms. Priyanka Roy and Dr. Sayan Paul – Written and proof read the article

Reference

  1. Wang C, Horby PW, Hayden FG, Gao GF. A novel coronavirus outbreak of global health concern. The Lancet. 2020;395(10223)470-473.
  2. Velavan TP, Meyer CG. The COVID‐19 epidemic. Tropical Med Int ealth. 2020;25(3)278.
  3. FAQ—Covid-19, domande erisposte.
  4. Abenavoli L, Cinaglia P, Luzza F, Gentile I, Boccuto L. Epidemiology of coronavirus disease outbreak- the Italian trends. Rev Recent Clin Trials. 2020;15.
  5. Gazzetta Ufciale.
  6. Moynihan AB, Van Tilburg WA, Igou ER, Wisman A, Donnelly AE, Mulcaire JB. Eaten up by boredom- Consuming food to escape awareness of the bored self. Frontiers in psychology. 2015;6;369.
  7. Yılmaz C, Gökmen V. Neuroactive compounds in foods- occurrence, mechanism and potential health effects. Food Research International. 2020;128;108744.
  8. Rodríguez-Martín BC, Meule A. Food craving- new contributions on its assessment, moderators, and consequences. Frontiers in PSYCHOLOGY. 2015;6;21.

  1. Ma Y, Ratnasabapathy R, Gardiner J. Carbohydrate Craving-not everything is sweet. Current opinion in clinical nutrition and metabolic care. 2017;20(4)261.
  2. Wu C, Chen X, Cai Y, Zhou X, Xu S, Huang H, et al. Risk factors associated with acute respiratory distress syndrome and death in patients with coronavirus disease 2019 pneumonia in Wuhan, China. JAMA internal medicine. 2020.
  3. Muscogiuri G, Pugliese G, Barrea L, Savastano S, Colao A. Comentary- Obesity- The “Achilles heel” for COVID-19?. Metabolism-Clinical and Experimental. 2020;108.
  4. Wang C, Pan R, Wan X, Tan Y, Xu L, Ho CS, et al. Immediate psychological responses and associated factors during the initial stage of the 2019 coronavirus disease (COVID-19) epidemic among the general population in China. Int J Environ Res Public Health. 2020;17;1729.
  5. Montemurro N. The emotional impact of COVID-19- From medical staff to common people. Brain, behavior, and immunity. 2020.
  6. Van Strien T. Causes of emotional eating and matched treatment of obesity. Current diabetes reports. 2018;18(6)35.
  7. Evers C, Dingemans A, Junghans AF, Boevé A. Feeling bad or feeling good, does emotion affect your consumption of food?- A meta-analysis of the experimental evidence. Neuroscience & Biobehavioral Reviews. 2018;92;195-208.
  8. Singh M. Mood, food, and obesity. Frontiers in psychology. 2014;5;925.
  9. Havermans RC, Vancleef L, Kalamatianos A, Nederkoorn C. Eating and inflicting pain out of boredom. Appetite. 2015;85;52-7.
  1. Crockett AC, Myhre SK, Rokke PD. Boredom proneness and emotion regulation predict emotional eating. Journal of health psychology. 2015;20(5)670-80.
  2. Muscogiuri G, Barrea L, Annunziata G, Di Somma C, Laudisio D, Colao A, et al. Obesity and sleep disturbance- the chicken or the egg?. Critical reviews in food science and nutrition. 2019;59(13)2158-65.
  3. Pugliese G, Barrea L, Laudisio D, Salzano C, Aprano S, Colao A, et al. Sleep apnea, obesity, and disturbed glucose homeostasis- epidemiologic evidence, biologic insights, and therapeutic strategies. Current Obesity Reports. 2020;9(1)30-38.
  4. Muscogiuri G, Barrea L, Aprano S, Framondi L, Di Matteo R, Laudisio D, et al. Sleep quality in obesity- does adherence to the mediterranean diet matter?. Nutrients. 2020;12(5)1364.
  5. Engin AB, Engin ED, Engin A. Two important controversial risk factors in SARS-CoV-2 infection- obesity and smoking. Environmental Toxicology and Pharmacology. 2020;103411.
  6. AYUSH T. Ayurveda’s immunity boosting measures for self care during COVID 19 crisis. YaN The Ministry of Ayurvedic, Unani, Siddha and Homeopathy (AYUSH), editor. 2020.
  7. Control CfD, Prevention, People who are at higher risk for severe illness.
  8. Dietz W, Santos‐Burgoa C. Obesity and its Implications for COVID‐19 Mortality. Obesity. 2020;28(6)1005.
  9. Zisberg A, Gur-Yaish N, Shochat T. Contribution of routine to sleep quality in community elderly. Sleep. 2010;33(4)509-514.