Socioeconomic inequality of catastrophic health expenditure in Manipur
Meitei M.1, Singh H.2*, Singh K.3
DOI: https://doi.org/10.17511/ijphr.2021.i05.01
1 Moirangthem Hemanta Meitei, Associate Professor, Department of Economics, Manipur University, Imphal, Manipur, India.
2* Haobijam Bonny Singh, Research Scholar, Department of Economics, Manipur University, Imphal, Manipur, India.
3 Kh.Jitenkumar Singh, Scientist-D, ICMR, National Institute of Medical Statistics, New-Delhi, Delhi, India.
Background: The incidence of catastrophic health expenditure (CHE) is one of the indicators for monitoring the performance of a health system in protecting the financial hardship after availing of the service. Further, CHE has also raised the issue of equity. Aim & Objective: To explore the determinants of CHE and also to measure the extent and contribution of socioeconomic factors in CHE in Manipur. Settings and Design: Manipur is a small hilly state located in the north-eastern region of India. The health expenditure in Manipur as part of the GSDP is very low and stands at 2.79%. This has made rapid growth and expansion of private health care in the state. A cross-section study of primary data of 200 households consisting of 1130 individuals reporting hospitalization during the last 365 days (during 2016) was identified and surveyed. Methods and Material: The incidence of CHE was defined when total health expenditure exceeds 10% of the total household expenditure. The OLS regression has been adopted to identify the significant factors of CHE. Concentration index and decomposition analysis measure the degree of socioeconomic inequality and its contributing factors respectively in Manipur. Results: The results show that the wealth index, economic crunch (p=0.022), type of disease (Neoplasm (p<0.01) & Genitourinary (p<0.05), the total number of episodes (p<0.05), and duration of stay in hospital (p<0.05) are found to be the significant factors in determining CHE. The concentration index and decomposition analysis indicate that the wealth index plays a vital role in socioeconomic inequality in CHE. Conclusions: The study reveals that the CHE mainly concentrates among the poor household, and intervention of health protection schemes should primarily be focused among the socially and economically backward households.
Keywords: Catastrophic Health Expenditure, Economic crunch, Socioeconomic inequality, Concentration index, Decomposition analysis
| Corresponding Author | How to Cite this Article | To Browse |
|---|---|---|
| , Research Scholar, Department of Economics, Manipur University, Imphal, Manipur, India. Email:  |
Moirangthem Hemanta Meitei, Haobijam Bonny Singh, Kh.Jitenkumar Singh, Socioeconomic inequality of catastrophic health expenditure in Manipur. Public Health Rev Int J Public Health Res. 2021;8(5):59-69. Available From https://publichealth.medresearch.in/index.php/ijphr/article/view/169 |
 |
 ©
© 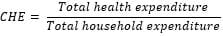
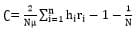 (1)
(1)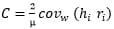 (2)
(2)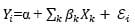 (3)
(3) (4)
(4)