E-ISSN:2349-4166
P-ISSN:2349-4158

Research Article

Socio-economic

Public Health Review - International Journal of Public Health Research

2016 Volume 3 Number 4 July-August
Publisherwww.medresearch.in

A cross sectional study to assess the socio-economic impact of falls in an urban community in South India

Vani CH.1*, Nandakumar B S.2, Murthy N S.3, Suryanarayana S. P.4
DOI: https://doi.org/10.17511/ijphr.2016.i4.03

1* Vani CH, Department of Community Medicine, Bangalore Medical College and Research Institute, Bangalore, Karnataka, India.

2 Nandakumar B S, Department of Community Medicine, M. S. Ramaiah Medical College, Bangalore, Karnataka, India.

3 Murthy N S, Department of Community Medicine, M. S. Ramaiah Medical College, Bangalore, Karnataka, India.

4 Suryanarayana S. P., Department of Community Medicine, M. S. Ramaiah Medical College, Bangalore, Karnataka, India.

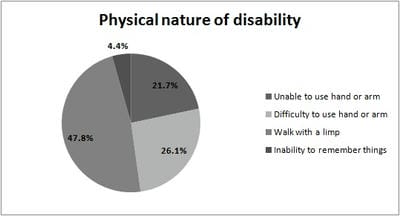
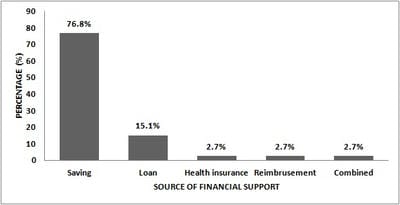
Background: Epidemiological transition have resulted the injuries to emerge as a global public health problem. Falls are one of the leading causes of injuries and has been predicted that it will be top 20 leading cause of death by 2030. Very few studies have been conducted about falls in all age groups. Hence the present study focussed on the prevalence of falls in an urban area, Bangalore and its social and economic impact on the individual and their family. Materials and Methods: Cross sectional study was conducted covering 3003 population by house-house survey. Pre-tested, semi-structured questionnaire was used. Among injured by falls further details was obtained. Results: Prevalence of falls was 23/1000 population; 95% CI (18-29). High prevalence was seen among extremes of age group and among males. Home was the common place of falls. Lower limb was common injury site and fracture was seen in 16.4% cases. Even after one month of injury, disability persisted in 31.5% cases. Hospital charges were high for elderly people (P=0.04). Total cost incurred following falls was high among 15-59 year age group (P=0.005). Conclusions: Prevalence of falls was 23/1000 population; 95% CI (18-29). Social impact in terms of disability lasting even after one month following falls was present in 31.5%, most common being limping. Though the prevalence of falls was high among extremes of age group, overall economic impact following falls was high among 15-60 year age group.

Keywords: Cost, Disability, Falls, Socio-economic impact, Urban area

Corresponding Author How to Cite this Article To Browse
Vani CH, , Department of Community Medicine, Bangalore Medical College and Research Institute, Bangalore, Karnataka, India.
Email:
Vani CH, Nandakumar B S, Murthy N S, Suryanarayana S P. A cross sectional study to assess the socio-economic impact of falls in an urban community in South India. Public Health Rev Int J Public Health Res. 2016;3(4):156-161.
Available From
https://publichealth.medresearch.in/index.php/ijphr/article/view/45

Manuscript Received Review Round 1 Review Round 2 Review Round 3 Accepted
2016-06-24 2016-07-08 2016-07-20 2016-08-05
Conflict of Interest Funding Ethical Approval Plagiarism X-checker Note
No Nil Yes 4%

© 2016 by Vani CH, Nandakumar B S, Murthy N S, Suryanarayana S. P. and Published by Siddharth Health Research and Social Welfare Society. This is an Open Access article licensed under a Creative Commons Attribution 4.0 International License https://creativecommons.org/licenses/by/4.0/ unported [CC BY 4.0].

Introduction

The epidemiological transition have resulted the injuries to emerge as a global public health problem not just in developed countries but also in developing countries like Asia. Injuries account to 9% of world’s mortality which is 1.7 times higher when compared to combined deaths due to HIV/AIDS, tuberculosis and malaria [1]. Among those who survive either suffers from temporary or permanent disability [2].

Among the various types of injuries, falls are one of the leading causes of injuries. A fall is an event which results in a person coming to rest inadvertently on the ground or floor or other lower level. Worldwide it’s the second leading cause of accidental or unintentional injury deaths, 80% of it occurring in low and middle income countries. Death following falls is high among elderly (>60 years). Non-fatal falls but those severe enough do require medical attention and account to 17 million DALYs lost [3].

According to WHO Global Health Estimates- 2014, falls accounted to 14% of all injury deaths in 2012. In the year 2012, falls ranked 21st among various leading causes of death and in the future it is predicted that falls will be 17th leading cause of death by 2030 [1]. According to National Crime Records Bureau (NCRB), falls accounted to 4.9% of major un-natural causes of accidental deaths in 2014 in India. In the year 2014; 2661 persons were injured while 15399 persons died due to falls, among which males accounted to 84.7% (13048). In Karnataka 31 people were injured due to falls and 539 persons died following falls, among which males accounted to 88.1% (475) [4].

Falls from height is recognized as a cause of serious paediatric trauma in some continents. Fall from buildings, windows can result in death or serious life time cognitive and physical disabilities. It can also result in traumatic brain injury, spinal cord injuries, major fractures and also psychological trauma [5]. Many studies have been conducted about risk factor for falls among elderly population both in hospitals and in the community. Few studies have also been conducted for paediatric age groups. But not many studies have been conducted to assess the impact of falls in terms of economic and social impact among all age groups. The present study is focussed to determine the prevalence of falls in an urban area, Bangalore and its social and economic impact on the individual and their family.

Materials and Methods

The present study is a part of larger study which mainly focussed on pattern of injuries and its socioeconomic impact in an urban community which has been described in detail elsewhere [6]. The present study focussed on to determine the prevalence of falls in an urban area and its social and economic impact on the individual and their family.

The methodology has been described in detail elsewhere [6]. The study population included all people residing at ward number 17 & 36, Mattikere, Bangalore out of which 3003 population was studied during June 2012- March 2013. Inclusion criteria consisted of any person who was residing in that area from the past 6 months and those who met with falls injury where the term “falls injury” had been described as trip, slip, stumble or fall on a level plane, from one level to another, or into a hole or other opening in a surface whether being unintentional or due to assault and self directed violence [7].

Fall of objects was also included in our study. Further the injuries were classified as mild, moderate injuries and severe injuries based on the number of days of incapacitation. Recall period of 12 months was used during data collection. Those refusing to give informed consent and those who were not willing to participate for their own reasons were excluded.

Fall from moving vehicles and fall into water i.e drowning were excluded. Information relating to moderate & severe falls injuries alone was collected in each of the households after obtaining informed consent from the participants. Mild injuries were excluded since in the pilot study it was observed that mild injuries resulted in minimal social and economic impact.

Statistical Analysis: SPSS -17software was used for analysis. The data was tabulated with respect to certain socio-demographic characters against falls injuries and their prevalence rate with 95% confidence interval was calculated. Qualitative variables were expressed in frequency and percentages. The quantitative data were summarized through descriptive measures such as mean, standard deviation, median and inter quartile range. Chi square test, Fisher exact test and Kruskal Wallis test were employed for evaluating statistical significance.


Ethical clearance was obtained from the institutional Ethical Committee for conducting the study. During the survey, informed consent was taken from all the individuals who provided information.

Results

Socio-demographic details of falls victims: Among 3003 people surveyed, 70 were injured while 3 people had two episodes of falls in the past one year of recall period. So total number of fall injuries in our study was 73.

The prevalence of falls was 23/1000 population with 95% confidence interval (CI) of (18-29). In our study falls was common among extremes of age group i.e high prevalence of 48 (40-56) among children aged ≤14 years and 23 (18-29) among ≥60 years was observed which was found to be statistically significant (χ2=22.3, P<0.01). Falls was more common among males. Its prevalence was high both in upper 36 (30-43) and lower 36 (29-42) socio economic status according to modified Kuppuswamy’s classification of socioeconomic status [8]. Falls prevalence was high among Muslim community but was not significant.


Table-1: Profile of falls according to various socio-demographic characteristics

Variables Groups Population at risk (n) Number injured by falls* Prevalence per 1000 population (95% CI) χ2 value (P value)
Age (years) ≤14 620 30 48 (40-56) 22.31 (<0.01)
15-59 2089 33 15 (11-20)
≥60 294 7 23 (18-29)
Gender Male 1533 43 28 (22-34) 3.15 (0.21)
Female 1466 27 18 (13-23)
Socio-economic status Upper 362 13 36 (30-43) 5.06 (0.28)
Upper middle 1335 26 19 (14-25)
Lower middle 757 21 28 (22-34)
Upper lower 521 9 17 (12-22)
Lower 28 1 36 (29-42)
Religion Hindu 2539 61 24 (18-30) 2.08 (0.35)
Muslim 309 8 26 (20-32)
Christian 155 1 6 (3-9)
Total (N) All 3003 70 23 (18-29)  
*Recall period of past 12 months and Figures in paranthesis indicate absolute numbers

Pattern of falls injuries- All the falls were of unintentional type 73 (100%). Home 28 (38.4%) was the most common place of falls followed by street 18 (24.7%), at work area 8 (11%), school 7 (9.6%), athletic and commercial areas 3 (4.1%) each and others 6 (8.1%). Fall of objects accounted to 15 (20.5%). Majority of falls occurred while playing 33 (45.2%) followed by during travelling 20 (27.4%), work related was 10 (13.7%), domestic activity 6 (8.2%) and others 4 (5.5%).

Falls resulted in fracture in 12 (16.4%) and sprain or strain in 17(23.3%) of them while 39 (53.4%) of them had cut or open wounds, 1 (1.4%) had concussion and 1 (1.4) experienced organ system injury. Lower limbs were the common site of injury 28 (38.4%) followed by head 21 (28.8%), upper limb 18 (24.7%), spinal injury 2 (2.7%), multiple sites in 4 (5.4%).

Among 73; 36 (49.3%) were severely injured resulting in partial or complete incapacitation of the injured person lasting ≥14 days (≥ 2 weeks) or resulting in permanent disability/coma/death in the past 12 months and rest of them were moderately injured 37 (50.7%).

Social impact of falls: Social impact of falls was assessed by number of days spent in hospital, working days lost by injured and care giver. Long term social impact of falls on the victim was assessed through falls resulting in loss of employment opportunity, affecting the children’s education and persistence of disability even after a month following falls.

Long term social impact of falls on the family was assessed through family breakups (i.e divorce, separation, splitting of families etc).


Among the injured 5 of them were admitted to hospital [for minimum period of 24 hours] for treatment for median (Inter Quartile Range-IQR) days of 15 (4-50). Minimum and maximum days spent in hospital were 4-70 days. Fifty four of them lost working days or injured children missed school for a period of 7 (IQR 4-30) days, minimum and maximum days being 1-90.

Time taken to return back to routine normal activities (among 73 injured) was 14 (7-36) days. Minimum and maximum days were 2-180 days.

Among the care givers 28 of them lost working days for 2 (2-7) minimum and maximum being 1-90 days. Among the care givers 42 people’s routine activity was disrupted due to this injury for median (IQR) days of 7 (2-16), minimum and maximum days being 1-180.

Irrespective of injury severity there was no family breakups, loss of employment opportunity nor was there any education loss. But more severe the falls greater was the disability and this was found to be statistically significant (χ2 =14.892, P <0.001).


Table-2: Distribution of falls by severity of injury and its social impact

Injury leading to family break up (n) Total Test of significance, degrees of freedom (df) & P value
Injury severity Yes No   Fisher exact test
df = 1
P =0.240
Moderate1 0 37 37
Severe2 2 34 36
Total 2 71 73
Injury leading to loss of employment opportunity Fisher exact test
df = 1
P= 1.00
Moderate1 1 36 37
Severe2 1 35 36
Total 2 71 73
Injury leading to education loss χ2 =1.730
df = 1
P = 0.188
Moderate1 4 33 37
Severe2 8 28 36
Total 12 61 73
Injury leading to impairment/activity limitation/ participation restriction after 30 days of injury χ2 =14.892
df = 1
P <0.001
Moderate1 4 33 37
Severe2 19 17 36
Total 23 50 73
1Moderate injuries -defined as any injury resulting in partial or complete incapacitation of the injured person lasting from 3rd day to 13 days in the past 12 months
2Severe injuries -defined as any injury resulting in partial or complete incapacitation of the injured person lasting ≥14 days (≥ 2 weeks) or resulting in permanent disability/coma/death in the past 12 months

Following falls injuries 23 (31.5%) experienced impairment/activity limitation/participation restriction even after 30 days of injury.

Figure-1: Proportion of physical nature of disability following falls injuries

public_45_01.jpg

Among the disabled walking with a limp was the common type 11(47.8%) followed by difficulty to use hand or arm 6(26.1%), unable to use hand or arm in 5 (21.7%) and 1(4.4%) was not able to remember things

Economic impact of falls: The economic impact was assessed through the expenditure met for travel, hospital, miscellaneous charges (direct cost) and wages lost by injured and caregiver (indirect cost). In our study the total direct expenditure (due to hospital, travel, miscellaneous charges) mean (SD) and median (IQR) value was Rs 17127 (68398) and Rs1500 (600-4050). Total indirect expenditure mean (SD) and median (IQR) value incurred (due to wages lost by injured and


caregiver) was Rs 9337 (15239) and Rs 3400 (500-9000) respectively. So total expenditure incurred by a family following falls injury was mean (SD) Rs 20197 (70114) and median (IQR) was Rs 2250 (1000-5300). The minimum and maximum total expenditure was Rs 100 and Rs 5 lakhs respectively.

Various expenditures incurred by injured and their family was analysed according to age wise. It was found that hospital charges were significantly high among elderly ≥60 years age group (P=0.04) while the total indirect expenditure was significantly high among 15-59 year age group (P=0.01). Overall total cost incurred following falls was high among 15-59 year age group and this was found to be statistically significant (P=0.005) by Kruskal Wallis test. Indirect expenditure incurred by injured (14) could not be computed since there were no values in extremes of age group.

Table- 3: Distribution of expenditure incurred by age wise among falls injuries

Age in years (n) Median [in Rs] P value (Kruskal Wallis test)
For travel charges (63)
≤14 (24) 225 (100-500) 0.59
15-59 (33) 500 (100-650)
≥60 (6) 200 (100-6545)
For hospital charges (73)
≤14 (32) 675 (162-1950) 0.04
15-59 (35) 1500 (500-4200)
≥60 (6) 1950 (312-232750)
For Miscellaneous charges (51)
≤14 (20) 350 (200-650) 0.52
15-59 (27) 500 (250-1500)
≥60 (4) 5170 (112-175010)
Total direct cost (73)
≤14 (32) 100 (312-3375) 0.06
15-59 (35) 2000 (800-7700)
≥60 (6) 2250 (475-304320)
Indirect expenditure incurred by Caregiver (14)
≤14 (8) 500 (462-6875) 0.05
15-59 (5) 1900 (1050-30000)
≥60 (1) 333 (333-333)
Total indirect cost (N=24)
≤14 (8) 500 (462-6875) 0.01
15-59 (15) 7500 (3000-20000)
≥60 (1) 333 (333-333)
Total cost incurred (73)
≤14 (32) 1100 (625-3500) 0.005
15-59 (35) 3750 (1600-15600)
≥60 (6) 2250 (675-304320)
Cost of 1 US dollar in year 2012-2013 = Rs 54.65
Cost of 1 US dollar for year 2016 = Rs 67.3

Majority of falls victims met their financial support through their savings 56 (76.8%), only 11 (15.1%) borrowed loan. Minimum and maximum loan amount was Rs 200-Rs 200000. Only 2 (2.7%) were covered by health insurance and another 2 (2.7%) got reimbursed while rest 2 (2.7%) of them had two or more combined sources.

Figure- 2: Bar chart showing the source of financial support to those injured by falls

public_45_02.jpg

Discussion

Efforts to reduce information bias (occurred while collecting details of number of days being injured, expenditures met by the family following an injury) was done by cross checking the medical bills, medical records and discharge summaries. Local event calendar was used to limit recall bias.

According to Bengaluru Injury surveillance programme (BISP- 2007), falls were more common among males 83% which was also observed in our study. For non-fatal injuries, 40% occurred at home, followed by 31% in work places and 18% on roads. Head (53%) was the common site followed by upper limbs and lower limbs. Fractures were seen in 54% of cases [9].

Both genders are at risk of falls in all age groups and worldwide. While fatal falls are commonly seen among males, non-fatal falls are more among women, probable reason being high risk taking behaviour among males and increased occupational exposure [3].

Falls are more commonly seen in extremes of age group i.e in children and older people which was also observed in our study. Falls related deaths are more in elderly probably due to physical, sensory, and cognitive changes associated with ageing in combination with environment which are not adapted for an aging population [3].


Childhood falls accounts to half of hospital emergency department visits [10]. Childhood falls occur largely as a result of their evolving developmental stages, innate curiosity of their surroundings, and increasing levels of independence leading to ‘risk taking’ behaviours. Complex circumstances like inadequate adult supervision, poverty, sole parenthood, and hazardous environments do play a role in childhood falls [3].

A study was conducted using million death study data to estimate fall related mortality. Falls accounted to 25% of all deaths from unintentional injury. Its mortality rate per 1 lakh population was 14.5 (99%CI 13.7-15.4). Elderly people (>70 years) had the highest mortality rate from unintentional falls (271.2; 99% CI: 249.0–293.5) and it was higher among women. In this study they observed that fall from height was common in younger age groups while fall on same level was commonly seen among elderly people [11].

Even in our study we found that irrespective of injury severity there was no family breakups (divorce, separation, etc), loss of employment opportunity nor was there any education loss (children missing school, not able to write tests or exams etc) indicating that both at workplace and at home the injured got enough support to sustain and go through the problems following falls.

In our study a single falls injury on an average accounted to Rs 20197 (US$ 370) to the injured and their family. Only 8.1% of them were covered under health insurance or reimbursement or both while rest of them had to meet their financial needs through savings and loans indicating a huge out of pocket expenditure following falls.

The financial costs from fall-related injuries are extensive. For people aged 65 years or older, the average health system cost per falls in the Republic of Finland and Australia are US$ 3611 and US$ 1049 respectively. Evidence from Canada suggests that implementation of effective prevention strategies would result in 20% reduction in the incidence of falls among children under 10 could create a net savings of over US$ 120 million each year [3].

A study conducted among elderly to estimates the cost of fatal and non-fatal falls in USA showed that 63% of non-fatal cost was spent for hospitalisation, 21% for emergency department visits and 16% for treatment in outpatient settings.

Medical expenditure was 2-3 times higher for women compared to men [12]. Even in our study hospital charges accounted to 58.5% of total expenditure incurred.

Conclusion

Prevalence of falls was 23/1000 population with 95% CI (18-29). The prevalence was high in extreme age group (≤14years and ≥60 years), among males and also among upper and lower socio economic status. Home was the common place of falls. Majority occurred during leisure time and while playing. Following falls 16.4% met with fracture and 23.3% met with sprain/strain. Lower limbs (38.4%) were the common injury site

Median number of working days lost or school missed by children was one week and median of two week time was taken to return back to normal routine activities by the injured. More severe the falls injury greater was the disability and this was statistically significant (χ2 =14.892, P <0.001). Disability even after 30 days was present in 31.5% of cases most common being walking with a limp. A single falls costed Rs 20197, minimum and maximum expenditure being Rs 100 and Rs 5 lakhs.

The hospital charges were significantly high among elderly ≥60 years age group (P=0.04). Total cost incurred following falls was high among 15-59 year age group (P=0.005). To conclude though the prevalence of falls were high among extremes of age group, the economic impact was significantly high among 15-59 year age group and was statistically significant. Hence we would like to recommend developing preventive and control measures to prevent falls among 15-59 year age group and not just concentrating on extremes of age group.

Since home was the common place of injury there is a need to develop safety precautions to avoid falls at home; example using anti-skid tiles for flooring, using mesh or barriers on windows and balconies etc. Most of the falls among children occurred while playing; hence use of protective equipments like helmets, knee caps, shoes etc would reduce the severity of falls impact.

We would also like to recommend to develop a comprehensive health care service (includes preventive, promotive, curative and rehabilitative health care service) to reduce the burden of falls in a community.


Also there is a need to create awareness among general public to utilise health insurance to reduce the out of pocket expenditure.

Acknowledgements

We extend our sincere thanks to Dr. G. Gururaj, Professor & HOD of Epidemiology, NIMHANS and Dr. Gautham M. S., Assistant Professor, Dept. of Epidemiology, NIMHANS, Bangalore for their valuable inputs. We would like to acknowledge the Principal, all the teaching and non-teaching staff, post graduates of Community Medicine department, M S Ramaiah Medical College, Bangalore. We are thankful to the residents of BBMP ward number 17 and 36 for their co-operation while conducting the study.

Reference

  1. INJURIES AND VIOLENCE THE FACTS 2014. 2016.
  2. WHO. Injuries. 2016.
  3. Falls. 2012.
  4. National Crime Records Bureau. Accidental deaths and suicides in India. New Delhi- NCRB. 2014.
  5. Pressley J, Barlow B. Child and adolescent injury as a result of falls from buildings and structures. Injury Prevention. 2005;11(5)267-273.
  6. C Vani, Suryanarayana S, Nandakumar B, Murthy N. A cross sectional study of pattern of injuries and its socio-economic impact in an urban area, Bangalore. Int J Community Med Public Health. 2016;3(2)419-425.
  7. McGee K, Sethi D, Peden M, Habibula S. Guidelines for conducting community surveys on injuries and violence. Inj Control Saf Promot. 2004 Dec;11(4)303-6.
  1. Kumar N, Gupta N, Kishore J. Kuppuswamy’s socioeconomic scale- updating income ranges for the year 2012. Indian J Public Health. 2012;56(1)103-4.
  2. NIMHANS. BISP Fact sheet on Injury among children 2007. Bengaluru- NIMHANS. 2007.
  3. WHO. 10 facts on injuries to children. 2016.
  4. Jagnoor J, Suraweera W, Keay L, Ivers R, Thakur J, Gururaj G, et al. Childhood and adult mortality from unintentional falls in India. Bulletin of the World Health Organization. 2011;89(10)733-740.
  5. Stevens J, Corso P, Finkelstein E, Miller T. The costs of fatal and non-fatal falls among older adults. Injury Prevention. 2006;12(5)290-295.