E-ISSN:2349-4166
P-ISSN:2349-4158

Research Article

Hospitalization

Public Health Review - International Journal of Public Health Research

2016 Volume 3 Number 5 September-October
Publisherwww.medresearch.in

Secular trends of hospitalization and in-hospital mortality rates of Q-wave and Non-Q-wave myocardial infarction in US: 1990-2006

Nath Ponna S.1*, Rao Pothula N.2, Prasad Upadrasta V.3
DOI: https://doi.org/10.17511/ijphr.2016.i5.04

1* Satyendra Nath Ponna, Scientist-D, Model Rural Health Research Unit, Chittoor, Andhra Pradesh, India.

2 Nageswar Rao Pothula, MD (Internal Medicine), CHRISTUS Spohn Hospital Corpus Christi, Corpus Christi, Texas, United States.

3 Venkata Prasad Upadrasta, Scientist-C, Model Rural Health Research Unit, Chittoor, Andhra Pradesh, India.

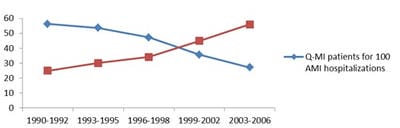
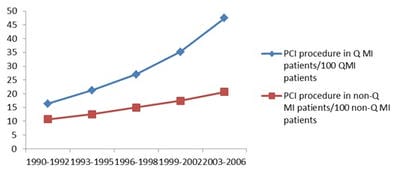
Background: Q-wave and non-Q-wave electrocardiogram (EKG/ECG) findings are proving to be significant prognostic factors for Acute myocardial infarction (AMI) as corroborated from previous studies has implications in patient care. Objective: To document secular changes in proportion of Q-wave myocardial infarction (QWMI) and NQWMI hospitalizations from 1990-2006 and its correlation with changes in demographics and co-morbidities like diabetes mellitus, hypertension and shock, cardiac interventions like PCI and CABG and to investigate change in risk of QWMI and NQWMI death rates from 1990 to 2006. Methods: Trend analysis of QWMI and NQWMI hospitalizations and in-hospital death rates from 1990-2006 of 1,22,841 patients aged ≥35 years admitted for AMI of National Hospital Discharge Survey population-based sample. Trends of QWMI and NQWMI hospitalization and death rates, procedure rates and risk of death from QWMI and NQWMI were documented. Results: The hospitalization rate of QWMI patients decreased from 56 for 100 AMI in 1990 and 92 to 27 for 100 AMI in 2003 and 2006, while hospitalization of NQWMI patients increased from 25 for 100 to 56 for100 AMI. There was increasing trend in PCI procedure rates in both QWMI and NQWMI patients while the trend for CABG procedure rates remained flat in QWMI patients compared to slightly decreasing trends in NQWMI. Conclusions: The increasing trends of NQWMI is in concurrence with increasing trends of diabetes mellitus and hypertension in the population, changes in the diagnostic criteria of AMI and evolution of new treatment patterns of PCI.

Keywords: Acute myocardial infarction, Q-wave Myocardial Infarction, Non-Q-wave Myocardial Infarction, Diabetes Mellitus, PCI, Coronary Artery Bypass Grafting

Corresponding Author How to Cite this Article To Browse
Satyendra Nath Ponna, Scientist-D, Model Rural Health Research Unit, Chittoor, Andhra Pradesh, India.
Email:
Ponna SN, Pothula NR, Upadrasta VP. Secular trends of hospitalization and in-hospital mortality rates of Q-wave and Non-Q-wave myocardial infarction in US: 1990-2006. Public Health Rev Int J Public Health Res. 2016;3(5):200-209.
Available From
https://publichealth.medresearch.in/index.php/ijphr/article/view/52

Manuscript Received Review Round 1 Review Round 2 Review Round 3 Accepted
2016-09-20 2016-10-05 2016-10-15 2016-10-30
Conflict of Interest Funding Ethical Approval Plagiarism X-checker Note
No Nil Yes 4%

© 2016 by Satyendra Nath Ponna, Nageswar Rao Pothula, Venkata Prasad Upadrasta and Published by Siddharth Health Research and Social Welfare Society. This is an Open Access article licensed under a Creative Commons Attribution 4.0 International License https://creativecommons.org/licenses/by/4.0/ unported [CC BY 4.0].

Introduction

Chronic disease is a significant burden to the society with an estimated minimum of one quarter of the population of the United States having at least one chronic illness, collectively accounting for 75% of US health care expenditures and ischemic heart disease contributes higher per capita and national costs among them [1, 2].

Coronary heart disease (CHD) is the principal illness of the heart disease. The clinical spectrum of CHD comprises of stable and unstable angina, non-ST segment elevation myocardial infarction (NSTEMI) and ST elevation myocardial infarction (STEMI), which are further sub classified into QWMI and NQWMI depending on the size or extent of underlying MI [3] and has prognostic implications in the management of MI. [4-6] Prior to the stent era, there was a significant decrease in the incidence of QWMI and increase in NQWMI [7] and as management of MI has evolved over time with the introduction of bare metallic stents and drug eluting stents had shown promising outcomes over coronary artery bypass grafting (CABG).

The short and long term outcomes are distinct for QWMI and NQWMI. [4-7] These dissimilarities are due to early spontaneous thrombolysis of a complete occlusion, relief of vasospasm, rapid healing of the underlying plaque disruption, more extensive collateral vessels in the presence of total occlusion and subtotal thrombotic burden in NQWMI [4] leading to decreased hospital mortality compared to QWMI. In contrast the long term outcomes for reinfarction are higher for NQWMI while mortality is same as QWMI. This discrepancy in the outcomes is related to jeopardized heart muscle in NQWMI and with the increasing incidence is a matter of great concern [4].

The trends from the recent literature review revealed declining prevalence of CHD risk factors, incidence of CHD and stable prevalence of AMI during the past decade in the United States, [8-10] despite declining incidence and mortality trends for AMI. It remains a question of public importance to determine the trends of QWMI and NQWMI were associated with trends of diabetes mellitus and hypertension and treatment patterns during this period. We also determined the trends of In-hospital mortality rate and risk of death from AMI after adjusting for demographics, co morbidities and complications of myocardial infarction.

Methods

Data Sources: The National Hospital Discharge Survey (NHDS) data from 1990 to 2006 was used in this study. The NHDS is conducted annually by the National Center for Health Statistics (NCHS) and is a good source of information on inpatient hospital utilization in the United States; calendar year 2006 was the most recent year in which complete data were available at the time this investigation began. The NHDS data contains information on characteristics of inpatients discharged from non-Federal short-stay hospitals in the United States [11]. The NHDS collects data from a sample of approximately 2, 70,000 inpatient records acquired from a national sample of about 500 hospitals [12]. Only hospitals with an average length of stay not exceeding 30 days, general hospitals or children’s general hospitals were included in the survey. Federal, military, and Department of Veterans Affairs hospitals, as well as hospital units of institutions (such as prison hospitals), and hospitals staffed to care for less than six patients, were excluded [13]. The NHDS survey design had previously been described in detail. In 1988, the NHDS was redesigned. Wherein the redesign samples were selected from a frame of short-stay hospitals listed in the 1987 Survey of Hospital Market Data Base. Hospitals with the most beds and/or discharges annually were selected with certainty, but the remaining samples were selected using a three-stage stratified design. The first stage was a sample of Primary Sampling Units (PSU) used by the National Health Interview Survey. Within PSU’s (which are counties, groups of counties, or county equivalents such as towns and townships), hospitals were stratified or arrayed by data collection types i.e. abstracting status (whether subscribing to a commercial abstracting service) and within abstracting status arrayed by type of service and bed size. Within these strata and arrays, a systematic sampling scheme with probability proportional to the annual number of discharges was used to select hospitals. The rates of systematic sampling of discharges within hospitals vary inversely with probability of hospital selection within PSU.

Study Subjects: Subjects of both sexes, aged ≥ 35 years who were hospitalized with Acute Myocardial Infarction as a primary diagnosis as defined by the ICD-9 CM code (ICD-9 CM codes 410.00-410.92) were included in this study [14].


Study variables: The primary outcome variables are age adjusted AMI hospitalization rate, QWMI & NQWMI proportional hospitalization rate and AMI mortality rate. They are examined across age groups: 35-54, 55-64, 65-74, 75-84 and 85+, by type of MI (QWMI vs. NQWMI), gender and year of admission. The AMI is classified based on the size of infarction with diagnostic codes 410.0-410.6 was classified as representing QWMI while those with diagnostic codes 410.7 as NQWMI.

Approximately 18% of MI patients were discharged with other specified (410.8-410.9) discharge diagnostic codes and were excluded from subgroup analysis. The independent variables were calendar year of admission, type of MI, age of patient diagnosed with MI, gender and geographical region. Covariates included the presence or absence of co-morbidities, including diabetes, hypertension, cerebrovascular disease and complications e.g. arrhythmia, cardiogenic shock as well as the use of cardiac procedures; catheterization, PCI, CABG up to 30 days from the date of index admission.

AMI Hospitalization data for the period 1990-2006 were analyzed, and based on this analysis 1,22,841 hospitalization records with AMI as a primary diagnosis were found. This was equivalent to a weighted national estimate of 14768909 hospitalizations or cases. The unit of analysis in this study is the “hospitalization” event, rather than the individual person, due to the fact that a “person” could potentially have more than one hospitalization.

Temporal trends were stratified by demographic, clinical and treatment characteristics in hospitalized MI patients were studied separately by MI type (QWMI vs. NQWMI). The study period 1990-2006 was stratified into five year groups (1990-1992, 1993-1995, 1996-1998, 1999-2002, 2003-2006) based on the modifications of treatment for MI during 1990-2006 and ease of presentation [15-17]. Based on the literature review from previous studies, we identified several demographic and clinical factors that predict the severity and prognosis of AMI patients [18-20].

After adjusting for covariates, the risk of death was determined using multiple logistic regression. The variables controlled included age, gender, year group of admission, geographical region, diabetes, cardiogenic shock, ventricular fibrillation, atrial fibrillation and atrial flutter.

Interventions were excluded from this analysis, because it depends on physician preferences and patient characteristics. These variables were controlled based on their association with mortality with AMI and difference in distribution of these factors in QWMI and NQWMI.

Statistical Analysis-Descriptive analysis was performed to determine proportions of QWMI and NWMI stratified by year of hospitalization versus socio-demographic characteristics, comorbidities and cardiac interventions.

Binomial logistic regression was carried out to determine association of year of hospitalization with risk of death from QWMI and NQWMI. Univariate regression analysis was carried out to determine assumption of independence of each variable and variables with minimum p-value of 0.25 were selected.

Regression analysis was carried out by backward likelihood ratio method. The fit of the model was tested by Hosmer and Lemeshow goodness-of-fit tests. All statistical analysis were performed by using SAS 9.1 (SAS institute, Cary, NC).

Results

Hospitalization rate of Acute Myocardial Infarction- The hospitalization rates of AMI during the seventeen year period from 1990-2006, a total of 14,768,909 patients were discharged from United States short stay hospitals with AMI as discharge diagnosis, with or without documentation of previous MI. We observed variation in the trends by type of MI.

A higher proportion of patients were discharged with diagnosis of NQWMI in later years. The hospitalization rate of QWMI decreased by 50% in younger age groups (less than 75 years) and by 80% in older age groups (greater than 75 years) while NQWMI hospitalization rate increased by 2 times in younger age group 55-74 years, ≥85 years and by 2.4 times in 35-54 and 75-84 year age groups (Table 1). In contrast, the hospitalizations for NQWMI were higher than QWMI in patients with diabetes mellitus and the trends were approximately flat in both types of MI. (Fig 1 and 2).

Table-1: Distribution of characteristics of Q-wave and Non Q-wave myocardial infarction hospitalizations in the United States: 1990-2006


  Q-wave myocardial infarction Non Q-wave myocardial infarction
Year Group 1990-1992 1993-1995 1996-1998 1999-2002 2003-2006 1990-1992 1993-1995 1996-1998 1999-2002 2003-2006
AMI patients 1317918 1339468 1243988 1354167 944693 582738 748960 920691 1705162 1950821
Age – group (Years) 35-54 21.37 22.75 22.7 23.72 12.14 13.72 14.17 14.27 13.83 24.29
55-64 22.44 21.81 21.64 22.25 19.44 16.85 17.51 16.74 17.28 23.03
65-74 27.58 27.09 27.12 22.44 29.22 29.91 28.08 24.19 22.7 21.15
75-84 21.18 29.02 21.41 21.51 27.74 27.47 28.62 29.21 28.08 19.92
85+ 7.43 7.43 7.13 10.08 11.46 12.05 11.62 15.58 18.11 11.62
Gender Female 37.15 39.29 38.53 37.37 41.41 43.74 41.81 46.52 45.67 37.18
Male 62.85 60.71 61.47 62.63 58.59 56.26 58.19 53.84 54.33 62.82
Race White 74.15 73.85 70.06 65.34 76.05 73.23 69.35 65.5 61.19 63.48
Black 6.35 5.37 5.45 5.67 6.37 7.08 7.09 7.23 8.5 6.61
Other 19.5 20.79 24.49 28.99 17.58 19.69 23.56 27.27 30.31 29.91
Comorbidities Diabetes 19.06 20.13 21.11 20.66 25.23 26.69 26.12 25.99 23.33 18.87
HTN * 3.15 2.72 3.17 4.65 6.47 7.58 8.37 8.64 11.69 5.95
stroke - 1.41 2.35 2.99   1.54 3.93 3.87 4.12 3.15
Complications Shock 3.24 3.35 3.36 3.06 1.13 0.98 0.91 0.96 0.86 3.64
VF 2.5 3.21 3.89 3.37 0.91 0.64 1.19 0.84 0.91 3.25
AF+AFL 26.78 29.8 31.31 34.88 31.72 34.98 38.36 41.31 46.31 37.97
Shock+VF 0.22 0.24 0.22 0.27 0 0.01 0.03 0.02 0.03 0.3
Interventions CATH 33.28 36.72 43.1 47.1 28.2 32.02 35.14 37.73 35.83 50.84
PCI 15.25 20.45 26.51 34.64 10.61 12.37 14.81 17.24 21.13 48.53
CABG 9.28 10.53 10.46 10.21 8.11 10.1 11.86 9.09 7.32 8.88

HTN: Secondary Hypertension, CVD: Cerebrovascular disease, VF: Ventricular Fibrillation, AF: Atrial fibrillation, AFL: Atrial Flutter

CATH: catheterization, PCI: percutaneous coronary intervention, CABG: coronary artery bypass grafting Values are in proportions

Table-2: In-Hospital risk of death from Q-wave myocardial infarction (QWMI) & Non Q-wave myocardial infarction (NQWMI)

  Q-wave MI Non-Q-wave MI
Year group Crude OR Adjusted OR 95% CI Crude OR Adjusted OR 95% CI
1990-92 1 1   1 1  
1993-95 0.84 0.802 (0.79,0.8) 0.9 0.907 (0.89, 0.9)
1996-98 0.8 0.754 (0.74, 0.7) 0.907 0.893 (0.89, 0.9)
1999-02 0.71 0.641 (0.63, 0.64) 1.2 1.143 (1.12, 1.15)
2003-06 0.64 0.54 (0.53, 0.54) 1.12 0.987 (0.97,0.99)

Clinical Characteristics of MI patients: The median age of patients with QWMI decreased from 67 years in 1990-1992 to 66 years in 2003-2006 while it increased from 71 to 73 years for NQWMI patients.

There was little change in the age distribution of either the QWMI or the NQWMI over the study time period except for a sharp decrease in 65-74yr age group and increase in 85 and over age-group in both types of MI (Table 1). Tables 1 depicts patient characteristics and age distribution in the 1990-2006 weighted analysis of NHDS sample population. The prevalence of co-morbidities like diabetes, hypertension, and cerebrovascular disease is more likely in NQWMI compared to QWMI. In contrast, complications resulting from MI are more prevalent in QWMI. There is increasing trend in cardiac intervention procedures like CATH, PCI and decreasing trend of CABG in both types of MI.

In-Hospital death rate-In-Hospital mortality decreased from 12.71% in 1990 to 8.57% in 2006 for QWMI patients while it increased slightly from 6.41% to 7.12% for NQWMI. Further, In-hospital mortality for NQWMI was lower compared to QWMI (Table 5). The crude odds ratio (OR) for death revealed a decreasing trend in QWMI and slightly increasing trend in NQWMI for In-hospital mortality (Table 2). These trends persisted after adjustment for age, gender, geographical region, co-morbidities and complications. These trends remained statistically significant (p-value< 0.05) for Q-wave & non-Q-wave MI.


Table-3: distribution of pci procedure of q-wave mi and non q-wave mi patients stratified by age & gender

  Q-wave MI Non Q-wave MI
1990-92 1993-95 1996-98 1999-02 2003-06 1990-92 1993-95 1996-98 1999-02 2003-06
Age Group 35-54 yrs 25.5 30.59 36.74 49.45 62.93 24.14 21.86 26.36 29.21 37.29
55-64 yrs 18.36 25.59 31.83 43.29 59.02 16.43 16.27 21.47 25.18 30.46
65-74 yrs 17.52 20.2 26.97 35.51 47.3 9.77 15.42 14.83 17.1 24.14
75-84 yrs 8.16 13.38 18.32 22.03 35.91 5.4 7.69 10.47 13.67 15.34
85+ yrs 3.14 6.76 7.41 11.1 21.5 1.76 1.04 3.01 5.78 5.1
Gender Male 17.83 23.92 29.48 39.34 54.26 12.95 14.53 17.46 21.44 25.11
Female 13.88 17.23 23.02 28.22 38.85 7.5 10.1 11.59 12.78 16.4

Table-4: Distribution of Q-wave myocardial infarction (QWMI) and Non Q-wave myocardial infarction (NQWMI) hospitalization stratified by gender and age group.

Males QWMI NQWMI QWMI NQWMI QWMI NQWMI QWMI NQWMI QWMI NQWMI
Year 35-54 35-54 55-64 55-64 65-74 65-74 75-84 75-84 85+ 85+
1990-1992 15.35 3.73 15.23 5.4 15.74 7.13 9.75 6.25 2.88 1.79
1993-1995 15.86 5.28 13.89 5.41 14.95 8.71 8.96 6.99 2.07 2.49
1996-1998 13.94 6.26 11.9 7.1 12.78 9.78 8.5 8.66 1.87 2.53
1999-2002 11.68 8.06 9.99 8.22 8.95 10.93 7.03 10.74 2.08 4.78
2003-2006 9.16 9.37 7.62 10.99 6.65 12.96 4.75 13.92 2 6.68
Females
Year 35-54 35-54 55-64 55-64 65-74 65-74 75-84 75-84 85+ 85+
1990-1992 7.04 1.96 8.72 3.99 15.16 7.47 15.16 7.87 6.12 4.44
1993-1995 7.06 2.47 8.62 4.57 13.95 9.35 14.43 10 6.68 5.2
1996-1998 6.02 3.05 7.75 4.68 12.83 9.83 12.42 11.93 6.27 5.53
1999-2002 4.31 4.28 5.29 6.6 6.77 10.75 8.47 16.14 5.52 9.81
2003-2006 3.24 5.6 4.43 7.93 4.53 12.33 6.21 17.98 4.61 14.55

Table-5: In-Hospital death rate of AMI by gender

Year Females Males
QWMI NQWMI QWMI NQWMI QWMI NQWMI QWMI NQWMI QWMI NQWMI QWMI NQWMI
35-64 35-64 65-74 65-74 75+ 75+ 35-64 35-64 65-74 65-74 75+ 75+
1990-1992 1.72 0.77 3.56 1.7 10.87 4.14 2.6 0.74 3.28 1.48 4.81 4.05
1993-1995 1.6 0.55 3.57 1.83 9.49 4.52 1.84 0.57 2.52 1.36 4.18 2.97
1996-1998 2.32 0.76 4.17 1.4 7.78 4.26 1.71 0.63 2.96 1.35 3.44 3.53
1999-2002 1.69 1.14 2.03 1.41 7.93 6.09 1.67 1.38 1.81 1.31 4.48 4.02
2003-2006 1.37 0.74 2.12 1.4 8.81 5.29 1.41 1.16 1.56 1.26 3.4 4.44

Fig-1: The trends revealed increasing hospitalizations of NQWMI and decreasing hospitalizations of QWMI

public_52_01.jpg

Fig 2: Trends revealed increasing PCI procedures in QWMI & NQWMI hospitalized patients

public_52_02.jpg


Trends of Interventions in patients with Invasive Cardiac Procedures- PCI procedures increased from 16% in 1990 to 47% in 2006 for QWMI and from 11% in 1990 to 21% for NQWMI. There was exponential increase in PCI procedures in Q-wave patients and steady increase in NQWMI patients (Fig 2).

When we stratify by age, the PCI procedures increased by 2.5 fod increase 35-54 and 65-74 years age group, 3 fold in 65-74 years, 4 fold in 75-84 years, 7 fold in 85+ from 1990 to 2006 in QWMI (Table 3) while 13% increase in 35-64 years, 2.5 fold increases in 65-84 /years and 3 fold increases in 85 and above age group for NQWMI (Table 3).

But we noticed high interventions in younger age groups than older age groups in both types of MI. When stratified by gender, males had higher procedures compared to females in both types of MI (Table 3). The CABG procedures revealed increasing trends from 9% in 1990 to 10% in 1996 and decreased to 9% in 2006 for QWMI while it increased from 8% in 1990 to 12% in 1996 and decreased to 7% in 2006 for non-Q-wave MI (Table 1)

Discussion

The study results of National Hospital Discharge survey (NHDS) data demonstrate decreased proportion of QWMI hospitalization from 1990 compared to increasing proportion for NQWMI. Further, transition was observed in 1999-2000 with the progressive higher hospitalization of NQWMI, in contrast to QWMI proportion declining steadily over time across all age groups in males and females.

The NQWMI hospitalizations is higher compared to QWMI in diabetes patients and remained static over the same period. While the hospital mortality rate for QWMI was higher than NQWMI despite decrease in hospitalization and mortality rate over time. The risk of death from QWMI had decreased after adjusting for covariates, while the risk of death had not changed for NQWMI.

Hospitalization Proportional rate-Studies prior to thrombolytic era had demonstrated increasing incidence of QWMI and NQWMI [21, 22] and studies during the thrombolytic era had shown increasing incidence of NQWMI and decreasing incidence of QWMI [7, 23]. Findings from a study of trends of STEMI and NSTEMI based on NRMI data revealed increasing hospitalization of NSTEMI [24].

Our study findings are in accordance with previous literature and this transformation of progressive increase in the NQWMI hospitalizations might be due to changes in the pathophysiology of atherosclerotic plaque with the increasing incidence of mild stenotic plaque [25, 26] and non-ruptured plaques with erosions [27] (more commonly associated with diabetes and younger age group) and increased risk of thrombosis [28, 29] (PAI-1 inhibitor and tissue factor in diabetics, obesity and hypertension).

The changes in the diagnostic criteria with the redefinition of AMI using troponin [30] as a biomarker with good sensitivity and specificity leading to probable distinction of unstable angina, NQWMI and QWMI [31-34].

The role of aspirin [35] in reducing the size of infarction leading to increasing incidence of unstable angina, use of thrombolytic therapy [24] and increasing prevalence of PCI [24, 36-38] in preventing the evolution of NQWMI to QWMI, use of statins in reducing the inflammation and LDL-cholesterol in reducing the incidence of CHD [39].

The increasing elderly population [40] in the united states and increasing prevalence of diabetes, hyperlipidemia and obesity [41] associated with other modifiable risk factors like hypertension, smoking, physical activity, poor dietary habits[42] contribute to incidence of AMI.

Hospital Mortality-Despite the decrease in the mortality rate in QWMI, the mortality rate of NQWMI hadn’t changed from 1990, but it varied by age group. It remained stable in all age groups except increase in 35-54 years age group in males and 75 years and above age group in females. This increase has further increased from the year 1999, which might be due to introduction of new diagnostic markers like troponin[30] with high sensitivity and specificity in the diagnostic criteria of AMI.

The mortality rate was higher in patients with AMI aged ≥75 years and had shown an increasing trend in NQWMI, which might be due to non-compliance with clinical guidelines due to contraindications in the elderly;[43] about 50% of NQWMI patients presenting without chest symptoms creating a difficulty in the diagnosis as diabetes mellitus might be attributable for silent ischemia and infarction;[44, 45] growing elderly population in the United States [46] and associated comorbidities such as renal insufficiency in NQWMI patients.


Limitations

The NHDS data is a continuous nationwide survey of short stay non-federal hospitals collecting information from medical records regarding demographics, diagnostic and procedural coding. We applied weights for sample to determine population proportional hospitalization rates and case fatality rates, providing an estimate for the United States.

The shortcomings of this data are lack of clinical details such as presenting characteristics of AMI (risk factors, prior MI), diagnostic criteria for AMI (ECG documentation of Q and non-Q waves and serum biomarkers), initial management and follow up, which might have contributed and could have explained the change in trends of AMI.

The distribution of diseases and treatment modalities vary by gender, ethnicity and depending on the genetic constitution of individual, the race is an important factor underreported in this data. However, the results from our study correlate with the findings from the recent studies on NRMI national data [25, 38].

Conclusions

The trends of decreasing hospitalization and incidence of QWMI with increasing prevalence of diabetes and hypertension and changes in diagnostic criteria, success of revascularization and their role in reducing hospital mortality as supported by many studies are quite impressive, but with the aging population of the United States, increasing prevalence of diabetes, obesity and hypertension, advances in the earlier recognition of MI are contributing to the increasing hospitalization of patients with NQWMI.

The stable hospital mortality of NQWMI with poor outcomes with interventions in the elderly population is a matter of concern, Hence more evidence is required with new treatment modalities in addressing the risk factors of the heart disease promoting individuals to change their dietary habits and life style as part of primary and secondary prevention.

Reference

  1. Shortell SM, Swartzberg J. The physician as public health professional in the 21st century. JAMA. 2008;Dec 24;300(24)2916-8.
  1. Druss BG, Marcus SC, Olfson M, Tanielian T, Elinson L, Pincus HA. Comparing the national economic burden of five chronic conditions. Health Affairs. 2001;Nov 1;20(6)233-41.
  2. Moon JC, De Arenaza DP, Elkington AG, Taneja AK, John AS, Wang D, et al. The pathologic basis of Q-wave and non-Q-wave myocardial infarction- a cardiovascular magnetic resonance study. Journal of the American College of Cardiology. 2004;Aug 4;44(3)554-60.
  3. Liebson PR, Klein LW. The non-Q wave myocardial infarction revisited- 10 years later. Progress in cardiovascular diseases. 1997;Apr 30;39(5)399-444.
  4. Moreno P, Schocken DD. Non-Q wave myocardial infarction- Pathophysiology and prognostic implications. Chest. 1984;Dec 31;86(6)905-9.
  5. Montague TJ, MacKenzie BR, Henderson MA, Macdonald RG, Forbes CJ, Chandler BM. Acute non-Q-wave myocardial infarction- a distinct clinical entity of increasing importance. CMAJ- Canadian Medical Association Journal. 1988;Sep 15;139(6)487.
  6. Furman MI, Dauerman HL, Goldberg RJ, Yarzbeski J, Lessard D, Gore JM. Twenty-two year (1975 to 1997) trends in the incidence, in-hospital and long-term case fatality rates from initial Q-wave and non-Q-wave myocardial infarction- a multi-hospital, community-wide perspective. Journal of the American College of Cardiology. 2001;May 1;37(6)1571-80.
  7. Parikh NI, Gona P, Larson MG, Fox CS, Benjamin EJ, Murabito JM, et al. Long-term trends in myocardial infarction incidence and case fatality in the National Heart, Lung, and Blood Institute’s Framingham Heart study. Circulation. 2009;Mar 10;119(9)1203-10.
  8. Hu FB, Stampfer MJ, Manson JE, Grodstein F, Colditz GA, Speizer FE, Willett WC. Trends in the incidence of coronary heart disease and changes in diet and lifestyle in women. New England Journal of Medicine. 2000;Aug 24;343(8)530-7.

  1. Arciero TJ, Jacobsen SJ, Reeder GS, Frye RL, Weston SA, Killian JM. Temporal trends in the incidence of coronary disease. The American journal of medicine. 2004;Aug 15;117(4)228-33.
  2. National Center for Health Statistics. Public Use Data Files- 1990-2006 National Hospital Discharge Survey, The US Department of Health and Human Services. Hyattsville, MD- Division of Health Care Statistics Hospital Care Statistics Branch 6525 Belcrest Road, Room 956 Hyattsville, MD 20782.
  3. National Hospital Discharge Survey Description. Available from: http://www. cdc. gov/nchs/about/major/hdasd/nhdsdes.
  4. Vital and Health Statistics. Design and operation of the NHDS- 1988 Redesign; Series 1- Programs and Collection Procedures No 39, in US Department of Health and Human Services Center for Disease Control and Prevention. National Center for Health Statistics- Hyattsville, MD. 2000.
  5. 11 International Classification of Diseases, 9th Revision, Clinical Modification, 6th edition. US Department of Health and Humans Services, National Center for Health Statistics, Health Care Financing Administration. .
  6. Gregg EW, Gu Q, Cheng YJ, Narayan KV, Cowie CC. Mortality trends in men and women with diabetes, 1971 to 2000. Annals of Internal Medicine. 2007;Aug 7;147(3)149-55.
  7. Braunwald E, Antman EM, Beasley JW, Califf RM, Cheitlin MD, Hochman JS, et al. ACC/AHA 2002 guideline update for the management of patients with unstable angina and non–ST-segment elevation myocardial infarction—summary article- a report of the American College of Cardiology/American Heart Association task force on practice guidelines (Committee on the Management of Patients With Unstable Angina). Journal of the American College of Cardiology. 2002; Oct 2;40(7)1366-74.
  1. Pollack CV, Antman EM, Hollander JE. 2007 focused update to the ACC/AHA guidelines for the management of patients with ST-segment elevation myocardial infarction- implications for emergency department practice. Annals of emergency medicine. 2008;Oct 31;52(4)344-55.
  2. Kostis WJ, Demissie K, Marcella SW, Shao YH, Wilson AC, Moreyra AE. Weekend versus weekday admission and mortality from myocardial infarction. New England Journal of Medicine. 2007;Mar 15;356(11)1099-109.
  3. Kostis JB, Wilson AC, Lacy CR, Cosgrove NM, Ranjan R, Lawrence-Nelson J. Time trends in the occurrence and outcome of acute myocardial infarction and coronary heart disease death between 1986 and 1996 (a New Jersey statewide study). The American journal of cardiology. 2001;Oct 15;88(8)837-41.
  4. Kostis JB, Wilson AC, O'Dowd K, Gregory P, Chelton S, Cosgrove NM, Chirala A, Cui T. Sex differences in the management and long-term outcome of acute myocardial infarction- A statewide study, MIDAS Study Group, Myocardial Infarction Data Acquisition System. Circulation. 1994;Oct 1;90(4)1715-30.
  5. Edlavitch SA, Crow R, Burke GL, Baxter J. Secular trends in Q wave and non-Q wave acute myocardial infarction- The Minnesota Heart Survey. Circulation. 1991;Feb 1;83(2)492-503.
  6. Goldberg RJ, Gore JM, Alpert JS, Dalen JE. Non-Q wave myocardial infarction- recent changes in occurrence and prognosis—a community-wide perspective. American heart journal. 1987;Feb 28;113(2)273-9.
  7. Goodman SG, Langer A, Ross AM, Wildermann NM, Barbagelata A, Sgarbossa EB, et al. Non–Q-Wave Versus Q-Wave Myocardial Infarction After Thrombolytic Therapy Angiographic and Prognostic Insights From the Global Utilization of Streptokinase and Tissue Plasminogen Activator for Occluded Coronary Arteries–I Angiographic Sub study. Circulation. 1998;Feb 10;97(5)444-50.

  1. Rogers WJ, Frederick PD, Stoehr E, Canto JG, Ornato JP, Gibson CM, et al. Trends in presenting characteristics and hospital mortality among patients with ST elevation and non-ST elevation myocardial infarction in the National Registry of Myocardial Infarction from 1990 to 2006. American heart journal. 2008;Dec 31;156(6)1026-34.
  2. Naghavi M, Libby P, Falk E, Casscells SW, Litovsky S, Rumberger J, et al. From vulnerable plaque to vulnerable patient a call for new definitions and risk assessment strategies- Part II. Circulation. 2003;Oct 14;108(15)1772-8.
  3. Naghavi M, Libby P, Falk E, Casscells SW, Litovsky S, Rumberger J, et al. From vulnerable plaque to vulnerable patient a call for new definitions and risk assessment strategies- part I. Circulation. 2003;Oct 7;108(14)1664-72.
  4. Virmani R, Kolodgie FD, Burke AP, Farb A, Schwartz SM. Lessons from sudden coronary death a comprehensive morphological classification scheme for atherosclerotic lesions. Arteriosclerosis, thrombosis, and vascular biology. 2000;May 1;20(5)1262-75.
  5. Toschi V, Gallo R, Lettino M, Fallon JT, Gertz SD, Ferna A, et al. Tissue factor modulates the thrombogenicity of human atherosclerotic plaques. Circulation. 1997;Feb 4;95(3)594-9.
  6. Vaughan DE. Plasminogen activator inhibitor-1 and the calculus of mortality after myocardial in farction. Circulation. 2003;Jul 29;108(4)376-7.
  7. Apple FS, Wu AH. Myocardial infarction redefined- role of cardiac troponin testing. Clinical Chemistry. 2001;Mar 1;47(3)377-9.
  8. Cina VG, Gök K, Kaptanoǧlu B. The prognostic value of serum troponin T in unstable angina. International journal of cardiology. 1996;Mar 31;53(3)237-44.
  9. Jaffe AS, Ravkilde J, Roberts R, Naslund U, Apple FS, Galvani M, Katus H. It’s time for a change to a troponin standard. Circulation. 2000;Sep 12;102(11)1216-20.
  1. Polanczyk CA, Lee TH, Cook EF, Walls R, Wybenga D, Printy-Klein G, et al. Cardiac troponin I as a predictor of major cardiac events in emergency department patients with acute chest pain. Journal of the American College of Cardiology. 1998;Jul 1;32(1)8-14.
  2. Antman EM, Grudzien C, Sacks DB. Evaluation of a rapid bedside assay for detection of serum c rdiac troponin T. Jama. 1995;273(16)1279-82.
  3. Mukamal KJ, Mittleman MA, Maclure M, Sherwood JB, Goldberg RJ, Muller JE. Recent aspirin use is associated with smaller myocardial infarct size and lower likelihood of Q-wave infarction. American heart journal. 1999;Jun 30;137(6)1120-8.
  4. Goldberg RJ, Spencer FA, Okolo J, Lessard D, Yarzebski J, Gore JM. Long-term trends in the use of coronary reperfusion strategies in acute myocardial infarction- a community-wide perspective. Journal of thrombosis and thrombolysis. 2007;Jun 1;23(3)163-71.
  5. Nallamothu BK, Young J, Gurm HS, Pickens G, Safavi K. Recent trends in hospital utilization for acute myocardial infarction and coronary reva scularization in the United States. The American journal of cardiology. 2007;99(6)749-53.
  6. Peterson ED, Shah BR, Parsons L, Pollack CV, French WJ, Canto JG, et al. Trends in quality of care for patients with acute myocardial infarction in the National Registry of Myocardial Infarction from 1990 to 2006. American heart journal. 2008;Dec 31;156(6)1045-55.
  7. Go AS, Iribarren C, Chandra M, Lathon PV, Fortmann SP, Quertermous T, et al. Statin and β-blocker therapy and the initial presentation of coronary heart disease. Annals of internal medicine. 2006;Feb 21;144(4)229-38.
  8. Avezum A, Makdisse M, Spencer F, Gore JM, Fox KA, Montalescot G, et al. Impact of age on management and outcome of acute coronary syndrome- observations from the Global Regist ry of Acute Coronary Events (GRACE). American heart journal. 2005;Jan 31;149(1)67-73.

  1. Mokdad AH, Bowman BA, Ford ES, Vinicor F, Marks JS, Koplan JP. The continuing epidemics of obesity and diabetes in the United States. Jama. 2001;Sep 12;286(10)1195-200.
  2. Yusuf S, Hawken S, Ounpuu S, Dans T, Avezum A, Lanas F, et al. Investigators IS- Effect of potentially modifiable risk factors associated with myocardial infarction in 52 countries (the INTERHEART study)- case-control study. Lancet. 2004;364(9438)937-52.
  3. Mehta RH, Roe MT, Chen AY, Lytle BL, Pollack CV, Brindis RG, et al. Recent trends in the care of patients with non–ST-segment elevation acute coronary syndromes- insights from the CRUSADE initiative. Archives of Internal Medicine. 2006;Oct 9;166(18)2027-34.
  1. Margolis JR, Kannel WB, Feinleib M, Dawber TR, McNamara PM. Clinical features of unrecognized myocardial infarction—silent and symptomatic eighteen year follow-up the Framingham study. The American journal of cardiology. 1973;Jul 31;32(1)1-7.
  2. Kwong RY, Sattar H, Wu H, Vorobiof G, Gandla V, Steel K, et al. Incidence and prognostic implication of unrecognized myocardial scar characterized by cardiac magnetic resonance in diabetic patients without clinical evidence of myocardial infarction. Circulation. 2008;Sep 2;118(10)1011-20.
  3. Day JC. Population projections of the United States, by age, sex, race, and Hispanic origin- 1992 to 2050. US Department of Commerce, Economics and Statistics Administration, Bureau of the Census. 1992.