E-ISSN:2349-4166
P-ISSN:2349-4158

Research Article

Incidences

Public Health Review - International Journal of Public Health Research

2014 Volume 1 Number 3 October-December
Publisherwww.medresearch.in

Survey on Incidences of Tuberculosis in Cachar District, Southern Assam, India

Chakraborty A.1, Choudhury P.2*, Bhattacharjee A.3, Dhar (Chanda) D.4
DOI: https://doi.org/10.17511/ijphr.2014.i3.01

1 Apurba Chakraborty, Associate Professor, Department of Zoology, Cachar College, Silchar, Assam, India.

2* Parthankar Choudhury, Ph.D., Associate Professor, Department of Ecology and Environmental Science, Assam University, Silchar, Assam, India.

3 Amitabha Bhattacharjee, Ph. D., Assistant Professor, Department of Microbiology, Assam University, Silchar, Assam, India.

4 Debadatta Dhar (Chanda), MD, Associate Professor, Department of Microbiology, Silchar Medical College and Hospital, Silchar, Assam, India.

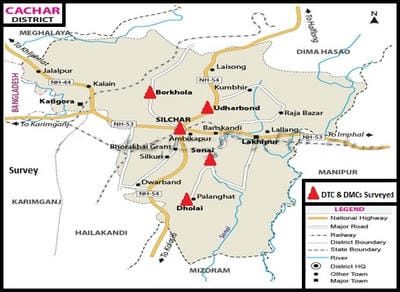
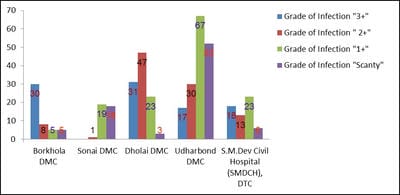
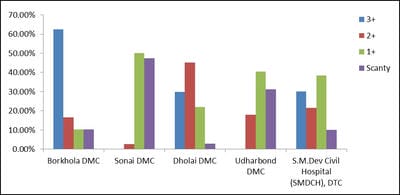
The terms environment and public health are interdependent. Environmental sanitation is the most important parameter that determines the public health of an area. Tuberculosis, a highly contagious disease, caused by the infection of a bacterium, Mycobacterium tuberculosis (a worldwide pandemic) results in more than two million deaths per year. Tuberculosis is most prevalent in underdeveloped countries due to unsanitary living conditions, crowded living quarters and marginalized group of people. Cachar district located at southern part of Assam of North East India has a population of about 17.5 lakhs. A survey on the incidences and severity of tuberculosis was carried out for a period of 19 months (January, 2013 to July, 2014) in the District Tuberculosis Centre (DTC) and Designated Microscopic Centres (DMCs) under RNTCP within the District of Cachar, Assam. The sputum samples of 416 victims were examined to confirm the infection and to ascertain the grades of infection. The results were analyzed according to different age groups, as per grades of infection and on segregation of infection among the males and females. Prevalence and magnitude of infections were found in conformity with the socio-economic status of the victims, most vulnerable age group is between 30-50 years and the infection in males outnumbered the females. The implementation of DOTS, the Stop TB strategy under The Revised National Tuberculosis Control Programme (RNTCP), has improved treatment success rates of tuberculosis and probably led to a decline in the duration of disease.

Keywords: Direct observation therapy, District Tuberculosis Centre, Mycobacterium tuberculosis, Revised National Tuberculosis Control Programme

Corresponding Author How to Cite this Article To Browse
Parthankar Choudhury, Ph.D., Associate Professor, Department of Ecology and Environmental Science, Assam University, Silchar, Assam, India.
Email:
Chakraborty A, Choudhury P, Bhattacharjee A, Dhar (Chanda) D. Survey on Incidences of Tuberculosis in Cachar District, Southern Assam, India. Public Health Rev Int J Public Health Res. 2014;1(3):61-69.
Available From
https://publichealth.medresearch.in/index.php/ijphr/article/view/8

Manuscript Received Review Round 1 Review Round 2 Review Round 3 Accepted
2015-02-18 2015-02-25 2015-02-27 2015-03-09
Conflict of Interest Funding Ethical Approval Plagiarism X-checker Note
No Nil Yes 5%

© 2014 by Apurba Chakraborty, Parthankar Choudhury, Amitabha Bhattacharjee, Debadatta Dhar (Chanda) and Published by Siddharth Health Research and Social Welfare Society. This is an Open Access article licensed under a Creative Commons Attribution 4.0 International License https://creativecommons.org/licenses/by/4.0/ unported [CC BY 4.0].

Introduction

The terms environment and public health are interdependent, because both are determined by the interplay and integration of internal environment of man himself and the external environment which surrounds him. In the modern concept, disease is due to a disturbance in the delicate balance between man and his environment. Therefore, the environmental sanitation is the most important parameter that determines the public health of an area [1]. WHO has defined environmental sanitation as the control of all those factors in man’s physical environment which exercises or may exercise a deleterious effect on the physical development, health and survival.

The term environment implies all the external factors-living and non-living, material and non-material which surround man. Environment not only includes water, air and soil that form our ambience, but also the social and economic conditions under which we live. The key to man’s health lies largely in his environment. The study of diseases is really the study of man and his environment [2].

Communicable diseases are infectious or contagious diseases transmissible from an affected individual to another by direct contact with the affected individual or through the affected individual’s discharges or through vectors. Tuberculosis, an infection caused by Mycobacterium tuberculosis, is a worldwide pandemic, and the Centers for Disease Control and Prevention (CDC) state that one-third of the world's population is infected with the bacteria. In the majority of those infected, however, the infection remains latent, meaning that it does not progress to an active disease. Many factors affect whether tuberculosis becomes an active infection that can then result in one of more than 2 million deaths a year caused by this bacteria [3].

Symptoms of Tuberculosis depend on the part of the body where the bacilli are growing. Most favourite site of infection is the lungs but their infection may be of extra-pulmonary. Usual symptoms include a bad cough that lasts 3 weeks or longer, pain in the chest, coughing up blood or sputum (phlegm from deep inside the lungs), weakness or fatigue, weight loss, no appetite, chills, fever etc.

Tuberculosis is most prevalent in underdeveloped countries due to unsanitary living conditions, crowded living quarters and lower income levels.

The incidence of active tuberculosis infection in Western Europe is only five per 100,000 people, whereas in Eastern Europe it is 50 to 100 per 100,000 [4]. The overall prevalence of disease in India is 544/100000 population. In Assam the prevalence rate is 710/100000 population which is much higher than the average all India scenario. The prevalence of tuberculosis is higher in rural areas than urban and is higher in males as compared to females [5].

Those who reside in close living conditions, such as in prisons, institutions and nursing homes, are at a higher risk of infection [3]. Tuberculosis is considered a disease of the poor and socially disadvantaged [4]. Socio-economic status is somewhat linked to environment because those with lower income status usually live in smaller spaces with more people residing in that confined space, have in general a known risk for infection.

In India, a national Tuberculin survey was carried out from 2000 to 2003 with the country stratified in to four zones (north, west, south & east). Nationally the annual risk of TB infection (ARTI) was 1.5% [6]. The annual risk of infection was higher in urban areas (2.2%; 1.8% - 2.6%) than in rural areas (1.3%; 1.0% - 1.5%) [7]. However, the implementation of DOTS (directly observed treatment short course, the basic package that underpins the Stop TB strategy, launched in 1997) under The Revised National TB Control Programme (RNTCP), piloted in India in 1993 has improved treatment success rates and probably led to a decline in the duration of disease.

WHO estimates suggest that the prevalence of all forms of TB decreased from 506 per 1,00,000 populations in 1995 to 280 in 2007, at a rate of about 6% per year while new smear positive TB decreased from 190 cases per 1,00,000 in 1995 to 100 in 2007 [8]. This paper aims at investigation of incidences of infection caused by Mycobacterium tuberculosis and to ascertain the severity of infection among the mass population of Cachar District of Southern Assam, India.

Material and Methods

The Barak Valley, located in the southern part of Assam, North East India, comprises of three districts, viz., Cachar, Hailakandi and Karimganj. The valley lying between 24082¢54¢¢ North latitude and 92077¢95¢¢ East longitudes, it covers a geographical area of 6921.10 km2.


The topography of the valley is heterogeneous having hills, wetlands and plain areas. The Barak-Surma-Kusiara river system passes through this valley. The valley is covered with a network of sluggish streams and saucer like depressions. Numerous hillocks stand all over the valley. The valley is also covered by hill ranges from North, East and South having vast tracts of forest land.

Climatic condition of the valley is characterized by high humidity to the extent of 96%. Average rainfall is as high as 2700-2800 mm and during recent past the minimum and maximum annual rainfalls have been recorded to be 2161 mm (in 2006) and 3498 mm (in 2010) respectively. During monsoon, the ambient air remains surcharged with moisture.

Lowest minimum and highest maximum temperature observed in the valley during winter and summer is 7.50C (on 16.01.2007) and 400C (on 04.05.2007) respectively, with the average low and high temperature of 9-100C and 37-380C respectively.

Cachar district occupies the geographical area of 3,786 square kilometres (1,462 sq mi) and the second largest district of the state of Assam, India. The Barak is the main river of the district and apart from that there are numerous small rivers which flow from Dima Hasao district, Manipur or Mizoram. The district is mostly made up of plains, but there are a number of hills spread across the district. The climate is Tropical wet with hot and wet summers and cool winters [9].

As per census of 2011 the total population of the valley is 36,12,581 with an average density of population is 543 per sq. Km. According to the 2011 census Cachar district has a population of 17,36,319. This gives it a ranking of 278th in India out of a total of 640. The district has a population density of 459 inhabitants per square kilometre (1,190/sqmi).

Decadal (2001- 2011) increase of population in the valley is 6,23,784 and the population growth rate of Cachar over the decade 2001-2011 was 20.17%. The district has a sex ratio of 958 females for every 1000 males, and a literacy rate of 80.36%. Population of Barak Valley is far higher than the Population figures of some of the North Eastern states like Nagaland (19,80,602), Arunachal Pradesh (13,82,611), Mizoram (10,91,014), Manipur (27,21,756) and Meghalaya (29,64,007).

public_08_01.jpg

Fig-1(a): Map of Assam, India

public_08_02.jpg

Fig-1(b): Map of Cachar District, Assam, India

Religious break-up of the population of Cachar District are Hindus 51.07%, Muslims 36.13% and rest are Christians and others. There are also few Mizo, Kuki and Khasi people who form microscopic minority of the district.

  1. B) Collection of sample and its analysis:

Surveillance of Tuberculosis in Cachar district, Assam under RNTCP comprised of Four Tuberculosis Unit (TU), viz. Silchar, Dholai, Kalain and Lakhipur. A total of twenty two Designated Microscopic centres (DMCs) are there under the TUs where diagnosis and treatment of TB is going on.

The study was carried out in District Tuberculosis Centre (DTC) [located at S. M. Dev Civil Hospital, Silchar], Borkhola and Udharbond DMCs under Silchar TU; Dholai and Sonai DMCs under Dholai TU for a period of 19 months (January, 2013 to July, 2014). Collection of sputum samples of the suspected TB patients and analysis of these were undertaken during the said period with necessary assistance from the technicians of the respective


DTC/DMCs in accordance with the procedure formulated by RNTCP in the form of Manual for Laboratory Technicians [10].

For diagnosis of tuberculosis, examinations of 3 sputum samples (SPOT-MORNING-SPOT) were performed and the result of morning sample is recorded.

The quality of the sputum sample is ensured first for microscopic examination. A good sample increases the chances of detecting AFB (Acid Fast Bacilli). In physical appearance a good sputum sample appears thick (semi-solid), coughed out deeply from the lungs, purulent (yellowish mucus), sufficient in amount (at least 2 ml). A poor quality sputum sample contains only saliva (watery fluid) or nasal mucus and is small in quantity (less than 2 ml). The slide for examination under microscope is prepared through the following the steps:

First a broomstick (wooden/bamboo) was breakup in to two halves with uneven ends and using the jagged ends of the broken stick, selected and picked up the larger, yellow, purulent portion of the sputum sample from the sample container onto the slide. Separate stick was used for each sample. Then, with another part of the sticks, the sputum was spread evenly to cover 2/3 of the central portion of the slide.

Thereafter, the applicators (broken wooden sticks) are disposed of into a bucket containing disinfectant and the smeared slide was then placed on the drying rack. The size of the smear should be approximately 3x2 cm. The smear should neither be too thick nor too thin. The slides were then allowed for air-drying for 15–30 minutes.

In the next step, the dry slides were fixed and dried by brief heating (at 50-60 0C). After drying of the slides, these were passed over the flame for 3–5 times, for about 3–4 seconds. Heating was done with the smeared side of the slides keeping upwards with the help of forceps and after heating the slides were transferred in the clean slide tray.

The slides were then stained with Carbol Fuchsin and gently heated, and allowed to stand for five minutes. Excess stain was removed from the slides with necessary care. At this point the sputum smears on the slides appears red in colour. In the next stage, the stained slides were decolourized with 25% sulphuric acid. As a result of this, the red colour of the smears almost disappears.

The slides are then counterstained with 0.1% methylene blue for 30 seconds and then air dried. The slides were examined under the microscope carefully putting a drop of immersion oil over the stained smears on the slides. The examination is done in a systematic and standardized manner. Examinations of at least 100 microscopic fields are necessary. The results are then recorded consulting the Table-1.

Results

Analysis of data on tuberculosis obtained in DTC, Cachar and different DMCs are tabulated according to: i) age groups, viz. 10 - 30, >30 - 50, >50 - 70 and >70-90 years of age as no case was found at the age of <10 and >90 years; ii) as per grades of infection, an indicator of severity of the disease [Table-2] and iii) segregating the incidences of afflictions with grades among the victims of two sexes- Male and Female individuals [Table-3].

Table-1: Grading of AFB smears [10]

Examination Result Grading No. of fields to be examined
More than 10 AFB per oil immersion field Positive 3 + 20
1–10 AFB per oil immersion field Positive 2 + 50
10–99 AFB per 100 oil immersion fields Positive 1 + 100
1–9 AFB per 100 oil immersion fields Scanty Exact number of AFB be recorded 200
No AFB per 100 oil immersion fields Negative 100

Table-2: Tuberculosis infections – Incidences and severity of infections with grades among the victims of different age groups.

Age Groups (years) → 10-30 >30-50 >50-70 >70-90 Total
Grading of infection → 3+ 2+ 1+ Scanty 3+ 2+ 1+ Scanty 3+ 2+ 1+ Scanty 3+ 2+ 1+ Scanty
Borkhola DMC 11 4 1 4 13 4 2   6   2 1         48
Sonai DMC     7 7   1 8 6     4 5         38
Dholai DMC 10 13 3 1 13 19 13   7 14 6 2 1 1 1   104
Udharbond DMC 3 11 28 18 10 14 30 20 3 4 9 11 1 1   3 166

S.M.Dev Civil Hospital (SMDCH), DTC 8 6 7   7 6 9 5 3 1 6 1     1   60

public_08_03.jpg

Fig-2(a): Number of positive cases of Tuberculosis detected grade wise out of the total number of sputum sample analysed

public_08_04.jpg

Fig-2(b): Percentage of positive cases of Tuberculosis of different grades in the area of survey

Out of the total 416 sputum sample of positive cases of Tuberculosis analysed, 96 cases found in “3+” grade of infections (23.07%). Highest percentage (62.50%) of “3+” grade of infections is found in Borkhola DMC followed by DTC at S.M.Dev Civil Hospital, Silchar (30.00%), Dholai DMC (29.80%) and in Udharbond DMC the lowest percentage (10.24%) is found. In Sonai DMC no case of “3+” grade of infection is found out of 38 positive cases investigated [Figure-2(a) & 2(b)].

Out of the total 416 sputum sample of positive cases of Tuberculosis analysed, 99 cases found in “2+” grade of infections (23.79%). Highest percentage (45.19%) of “2+” grade of infections is found in Dholai DMC followed by DTC at S.M.Dev Civil Hospital, Silchar (21.66%), Udharbond DMC (18.07%) and Borkhola DMC (16.66%) and in Sonai DMC the lowest percentage (10.24%) is found. In Sonai DMC only one case of “2+” grade of infection is found out of 38 positive cases investigated [Figure-2(a) & 2(b)].

Out of the total 416 sputum sample of positive cases of Tuberculosis analysed, highest number (137) of cases found in “1+” grade of infections

(32.93%). Highest percentage (50.00%) of “1+” grade of infections is found in Sonai DMC followed by Udharbond DMC (40.36%), DTC at S.M.Dev Civil Hospital, Silchar (38.33%) and Dholai DMC (22.11%) and in Borkhola DMC the lowest percentage (10.40%) is found [Figure-2(a) & 2(b)].

Out of the total 416 sputum sample of positive cases of Tuberculosis analysed, 84 cases found in “Scanty” grade of infections (20.19%). Highest percentage (47.36%) of “Scanty” grade of infections is found in Sonai DMC followed by Udharbond DMC (31.32%), Borkhola DMC (10.40%) and DTC at S.M.Dev Civil Hospital, Silchar (10.00%) and in Dholai DMC the lowest percentage (2.88%) is found [Figure-2(a) & 2(b)].

In Sonai DMC 97.36% cases comprised of “1+” and “Scanty” grade, only one case found of “2+” grade and no case of “3+” grade found out of the total 38 cases analysed.

Highest number of Tuberculosis afflictions of all the four grades is found in the age group >30-50 years followed by age group 10-30 years and age group >50-70 years. In the age group >70-90 years, the affliction is found negligible in comparison with the age groups up to 70 years of age. The male subjects are found more susceptible than the female as found on segregation of data in to incidences of afflictions among the male and female sexes.

In the age group 10-30 years afflictions to male subjects is 74 out of 142 (52.11%); it is 126 out of 180 (70.00%), 73 out of 85 (85.88%) and 7 out of 9 (77.77%) in the age groups >30-50, >50-70 and >70-90 years respectively. Highest percentage of afflictions to males occurs in the age group of >50-70 years of age [Table-3].

Discussion

The development of tuberculosis in humans is a two-stage process in which a susceptible person exposed to an infectious case first becomes infected and second, after an interval of years or decades, may later develop the disease, depending on a variety of factors like the risk of exposure, the risk of infection and the risk of developing disease [11]. The risk factors for infection are quite different from those for development of disease after infection [12].


Housing conditions are used as socio-economic indicators of health and well-being [13, 14, 15, 16]. Poor housing quality and overcrowding are associated with poverty, specific ethnic groups and increased susceptibility to disease [16, 17, 18]. Crowding, poor air quality within homes as a result of inadequate ventilation, and the presence of mold and smoke contribute to poor respiratory health in general and have been implicated in the spread and/or outcome of tuberculosis (TB) [19, 20, 21, 22].

Homes that have inadequate ventilation are often damp or have mold growth resulting from high humidity and condensation. Mold could be considered a proxy indicator of inadequate ventilation; however, homes that have a great deal of air leakage may also have mold [23]. Inadequate ventilation is one of multiple factors that contribute to the development of mold in a home.

Household humidity and encumbered space may also contribute to mold growth in a house. A higher incidence of TB transmission to children has been associated with exposure to environmental tobacco smoke. Children who had contact with index cases who were smokers showed a higher infection rate than those in contact with index cases who were non-smokers [24].

The Mycobacterium tuberculosis bacilli become aerosolized in to droplets of less than 5 μm diameter in an individual having active respiratory TB and the infection of tuberculosis spread with the coughing or sneezing of such individual. An increased density of droplet nuclei in the air leads to an increased risk of infection [21].

The aerosolized droplets settle very slowly and can remain suspended in the air for many hours. Therefore, TB transmission occurs with greater prevalence in poorly ventilated and crowded spaces [15, 21, 25, 26].

In the present study, the population under Borkhola DMC is found to be more susceptible to TB infection. The study revealed highest percentage (62.50%) of “3+” grade of infections in Borkhola DMC followed by 16.66% of “2+” grade of infections and 10.40% infections both in “1+” and “Scanty” grades of infection. On the other hand, the population under Sonai DMC is found to be less susceptible to TB infection in comparison with other DMCs where the study had been carried out.

In Sonai DMC 97.36% cases comprised of “1+” and “Scanty” grade, only one case found of “2+” grade and no case of “3+” grade found out of the total 38 cases analysed. The severity of infections in an area is an indicator of the socio-economic status of the local population which ultimately implicate an intimate relationship between the poor housing conditions, overcrowding and unhygienic environment with the prevalence and severity of TB infections.

Characteristics of the environment which favour the transmission of infection include the size of the space and the ventilation. Obviously, the smaller the space and the poorer the ventilation, the higher is the risk.

Further, the DTC (located at S.M. Dev Civil Hospital) is situated in the Silchar city, District Headquarter of Cachar, Assam. The segment of population covered by the DTC mainly comprised of socio-economically upright average urban population in comparison with the population of DMCs which comprised of comparatively socio-economically backward rural and sub-urban populations. The DTC also covers the populations of a number of slums of the Silchar city as well as some socio-economically backward classes.

During the survey, second highest percentage of “3+” (30.00%) and “2+” (21.66%) grades of infection is found in this DTC followed by third highest percentage of “1+” grade of infection (38.33%). These may be due to congested, overcrowded, unhygienic and polluted (with dust, smoke and excessive moisture) environment of the Silchar city that favours the transmission of M. tuberculosis bacilli. This observation goes against the general Indian scenario, where the average trend of infection is higher in rural areas than the urban counterparts. However, among the urban mass, in slums, which are overcrowded and unhygienic areas, deviations from the normal trend have been witnessed.

Age and sex variations in the prevalence of tuberculosis infection and disease have been reported worldwide, in both developed and developing countries [27, 28]. Early tuberculin skin test surveys have shown that infection with M. tuberculosis increases with age and then declines in older adults [29, 30]. The prevalence of tuberculin sensitivity is usually similar in males and females until adolescence, after which prevalence is higher among males [28, 31].


This difference after adolescence may reflect greater exposure among adult males because of differentiated social roles and economic activities [32], but it also may reflect a genuine sex difference in susceptibility to tuberculosis infection related to a different predisposition to responsiveness to delayed-type hypersensitivity [33].

Accordingly, the more or less middle aged groups i.e. the age group >30-50 years is to be considered most vulnerable for TB infection as highest number of infections of all the four grades is found in this age group. Further, the male subjects are found more susceptible than the females. In the four age groups, segregated here, the males outnumbered the female subjects and highest percentage of afflictions to males occurs in the age group of >50-70 years of age.

Tuberculosis is a multifactorial disorder in which environment interacts with host-related factors, contributing to the overall phenotype. Many factors play a role in individual susceptibility to M. tuberculosis. Understanding the individual balance between degree of exposure and inherited genetic susceptibility to infection, as well as the respective effects of environmental and host-related factors in development of tuberculosis disease, will have strong implications on tuberculosis control and prevention. Finally, the lack of adequate healthcare facilities of the district and inaccessibility of the area creates an alarming situation in terms of M. tuberculosis infections and other types of contagious diseases.

Acknowledgement

The authors expressed their deep sense of gratitude to the Joint Director of Health Services, Cachar, Silchar, Assam (India) for according necessary/requisite permission to carry out the study in the Govt. Health Centres of the district. The authors are also indebted to the Members of Ethical Committee, Silchar Medical College and Hospital, Silchar, Assam (India) for their approval on continuance of the study with human subjects.

The authors are also thankful to the Technicians of the Govt. Health Centres of Cachar District, Assam for their untiring help and cooperation during the period of study in general and in preparation and examination of smears of sputum samples in particular.

Finally, the authors are grateful to other members of the Govt. Health Centres of the district who helped immensely during the whole period of the study vis-à-vis provide necessary information and valuable suggestions in preparation of manuscript of the paper.

Reference

  1. Bera, AK. Environmental Concept, New Central Book Agency (P) Ltd; 8/1. Chintamoni Das Lane, Calcutta- 700009. 2001;124-129.
  2. Mukhopadhyay BB. Statistical Methods in the study of Assessment of Risk due to Environmental Pollution, In- Choudhuri MA, Das A, Ghosh AR, editors- Environment- Issues and Challenges Vol II, Second ed Director, Academic Staff College. The University of Burdwan, Burdwan, West Bengal. 2000;269-270.
  3. Centers for Disease Control and Prevention (CDC). 1600 Clifton Rd, Atlanta, GA 30333. USA Reported Tuberculosis in the United States. 2009.
  4. Malin AS, Mc Adam KP. Escalating threat from tuberculosis- the third epidemic. Thorax- an International Journal of Respiratory Medicine of British Thoracic Society. 1995;50;S37-S42.
  5. Dutta I, Bawari S. Health and healthcare in Assam- A Status Report. Centre for Enquiry into Health and Allied Themes, Mumbai-400055. 2007;77-78.
  6. Chadha VK, Vaidyanathan PS, Jagannatha PS. Annual Risk of Tuberculosis Infection in Different Zones of India- A national sample survey 2000-2003, Tuberculosis Research Centre. Indian Council of Medical Research, Chennai, India. 2003.
  7. Chadha VK, et al. Average annual risk of tuberculosis infection in India. International Journal of Tuberculosis and Lung Disease. 2005;9(1)116-8.

  1. World Health Organization. A brief history of Tuberculosis control in India. (WHO/HTM/TB/2010. 4).
  2. Bhattacharjee PR, Nayak P. “Socio-Economic Rationale of a Regional Development Council for the Barak Valley of Assam”. Journal of NEICSSR. Vol-27(1)2003;13-26.
  3. Revised National Tuberculosis Control Programme (RNTCP). Manual for Laboratory Technicians, Central TB Division, Directorate General of Health Services. Ministry of Health and Family Welfare, Nirman Bhavan, New Delhi 110 011. 1999;01-31.
  4. Lienhardt C. From Exposure to Disease- The Role of Environmental Factors in Susceptibility to and development of tuberculosis. Epidemiologic Reviews- Johns Hopkins University Bloomberg School of Public Health. 23(2)2001;2.
  5. Comstock GW. Frost revisited- the modern epidemiology of tuberculosis. Am J Epidemiol. 1975;5;363–82.
  6. O'Donnell V, Tait H. Aboriginal Peoples Survey 2001- initial findings- Well- being of the non-reserve Aboriginal population. 2001. Available
  7. Shaw M. Housing and Public Health. Annual Review of Public Health. 2004;25;397-418.
  8. Hawker JI, Bakhshi SS, Ali S, et al. Ecological analysis of ethnic differences in relation between tuberculosis and poverty. BMJ. 1999;319;1031-34.
  9. McHardy M, O'Sullivan E. First Nations Community Well-Being in Canada- The Community Well-Being Index (CWB), 2001. Strategic Research and Analysis Directorate, Indian and Northern Affairs Canada. 2004.
  10. Cantwell M, McKenna MT, McCray E, et al. Tuberculosis and race/ethnicity in the United States- Impact of Socioeconomic Status. Am J Respir Crit Care Med. 1998;157;1016-20.
  1. Kunimoto D, Sutherland K, Wooldrage K, et al. Transmission characteristics of tuberculosis in the foreign-born and the Canadian-born populations of Alberta, Canada. Int J Tuberc Lung Dis. 2004;8;1213-20.
  2. Wanyeki I, Olson S, Brassard P, et al. Dwellings, crowding, and tuberculosis in Montreal. Soc Sci Med. 2006;63;501-11.
  3. Dales R, Zwanenburg H, Burnett R, et al. Respiratory health effects of home dampness and molds among Canadian children. Am J Epidemiol. 1991;134;196-203.
  4. Beggs CB, Noakes CJ, Sleigh PA, et al. The tran smission of tuberculosis in confined spaces- An analytical review of alternative epidemiological models. Int J Tuberc Lung Dis. 2003;7;1015-26.
  5. Clark M, Riben P, Nowgesic E. The association of housing density, isolation and tuberculosis in Canadian First Nations communities. Int J Epidemiol. 2002;31;940-43.
  6. Dales R, Miller D, White J, et al. Influence of residential fungal contamination on peripheral blood lymphocyte populations in children. Archives of Environmental Health. 1998.
  7. Singh M, Mynak ML, Kumar L, et al. Prevalence and risk factors for transmission of infection among children in household contact with adults having pulmonary tuberculosis. Archives of Disease in Childhood. 2005;9;624-28.
  8. Elender F, Bentham G, Langford I. Tuberculosis mortality in England and Wales during 1982-1992- Its association with poverty, ethnicity and AIDS. Soc Sci Med. 1998;46(6)673-81.
  9. Valin N, Antoun F, Chouaid C, et al. Outbreak of tuberculosis in a migrants' shelter, Paris, France, 2002. Int J Tuberc Lung Dis. 2005;9;528-33.
  10. Vynnycky E, Fine PE. The natural history of tuberculosis- the implications of age-dependent risks of disease and the role of reinfection. Epidemiol Infect. 1997;119;183-201.

  1. Roelsgaard E, Iversen E, Blocher C. Tuberculosis in tropical Africa. Bull World Health Organ. 1964;30;459-518.
  2. Andersen S, Geser A. The distribution of tuberculous infection among households in African communities. Bull World Health Organ. 1960;22;39-60.
  3. Narain R, Nair SS, Rao GR, et al. Distribution of tuberculosis infection and disease among households in a rural community. Bull World Health Organ. 1966;34;639-54.
  1. Sutherland I, Svendova E, Radhakrishna S. The development of clinical tuberculosis following infection with tubercle bacilli. Tubercle. 1982;63;255-68.
  2. Hudelson P. Gender differentials in tuberculosis- the role of socio-economic and cultural factors. Tuber Lung Dis. 1996;77;391^00.
  3. Fine, PEM. Immunities in and to tuberculosis: implications for pathogenesis and vaccination, In- Porter JMH, McAdam KPWJ, eds, Tuberculosis, back to the future. London, United Kingdom- John Wiley & Sons, Inc. 1994;53-74.